
Technical Analysis and Outlook:
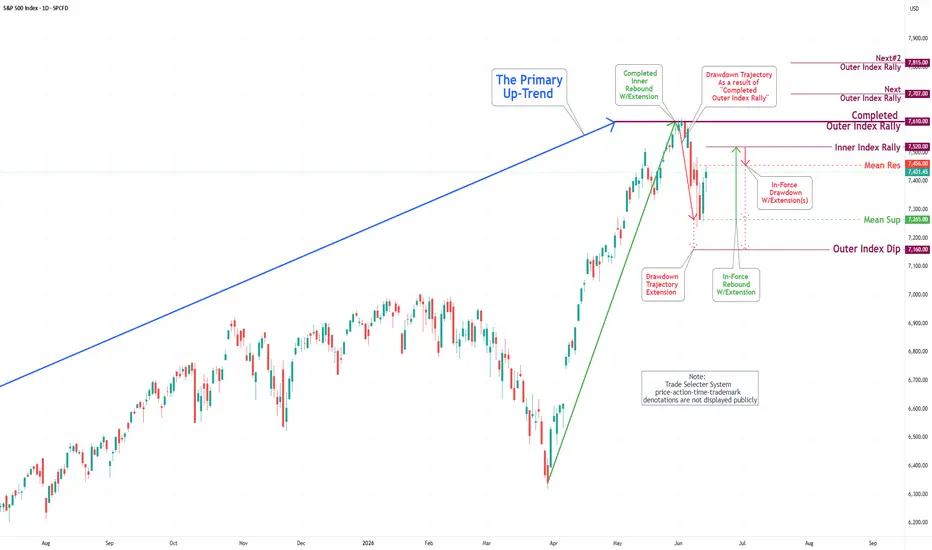
In this week's trading session, the S&P 500 Index experienced a substantial decline followed by a robust rebound, establishing a significant Mean Support level at 7,265.
At present, the Index is rebounding, with the primary target identified as the Inner Index Rally level at 7,520, while the current Mean Resistance is at 7,456.
Projections for the forthcoming trading sessions suggest that, upon reaching the Inner Index Rally level of 7,520, an In-Force pullback may occur towards the Mean Resistance at 7,456, which serves as an inverse support level.
Furthermore, there is a considerable likelihood of continued downward movement, leading to a retest of the critical Mean Support at 7,265, with the potential for a further decline extending to the ultimate Outer Index Dip at 7,160.
In this week's trading session, the S&P 500 Index experienced a substantial decline followed by a robust rebound, establishing a significant Mean Support level at 7,265.
At present, the Index is rebounding, with the primary target identified as the Inner Index Rally level at 7,520, while the current Mean Resistance is at 7,456.
Projections for the forthcoming trading sessions suggest that, upon reaching the Inner Index Rally level of 7,520, an In-Force pullback may occur towards the Mean Resistance at 7,456, which serves as an inverse support level.
Furthermore, there is a considerable likelihood of continued downward movement, leading to a retest of the critical Mean Support at 7,265, with the potential for a further decline extending to the ultimate Outer Index Dip at 7,160.

Pubblicazioni correlate
Declinazione di responsabilità
Le informazioni e le pubblicazioni non sono intese come, e non costituiscono, consulenza o raccomandazioni finanziarie, di investimento, di trading o di altro tipo fornite o approvate da TradingView. Per ulteriori informazioni, consultare i Termini di utilizzo.
Pubblicazioni correlate
Declinazione di responsabilità
Le informazioni e le pubblicazioni non sono intese come, e non costituiscono, consulenza o raccomandazioni finanziarie, di investimento, di trading o di altro tipo fornite o approvate da TradingView. Per ulteriori informazioni, consultare i Termini di utilizzo.