
It’s an incredible time for retail investors: the market is pumping non-stop, and it seems like it could continue indefinitely.
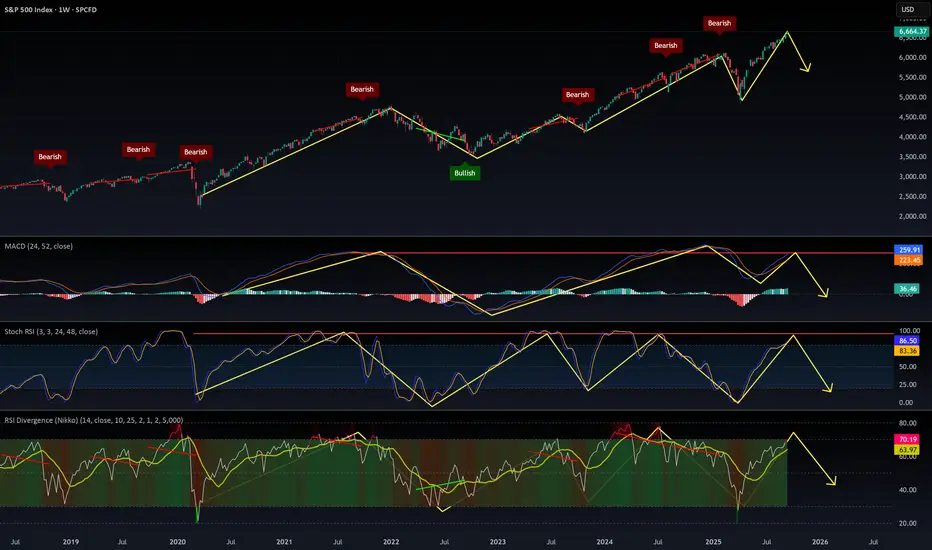
However, the charts are signaling a different scenario as we approach October.
MACD is at the top of its range
RSI is at the top of its range
Stochastic is at the top of its range
While liquidity remains high and rate cuts appear increasingly likely, history shows that when these indicators reach such extremes on the 1-week timeframe, a market correction often occurs. This reset can pave the way for further growth.
In short, we may see a correction, sideways movement, or a pause, most likely starting in October.
Anything is possible, but the charts don’t lie—even if sentiment can be misleading.
Monitor the situation closely: a market correction can also be a great opportunity to buy at lower prices.
DYOR.
However, the charts are signaling a different scenario as we approach October.
MACD is at the top of its range
RSI is at the top of its range
Stochastic is at the top of its range
While liquidity remains high and rate cuts appear increasingly likely, history shows that when these indicators reach such extremes on the 1-week timeframe, a market correction often occurs. This reset can pave the way for further growth.
In short, we may see a correction, sideways movement, or a pause, most likely starting in October.
Anything is possible, but the charts don’t lie—even if sentiment can be misleading.
Monitor the situation closely: a market correction can also be a great opportunity to buy at lower prices.
DYOR.

Declinazione di responsabilità
Le informazioni e le pubblicazioni non sono intese come, e non costituiscono, consulenza o raccomandazioni finanziarie, di investimento, di trading o di altro tipo fornite o approvate da TradingView. Per ulteriori informazioni, consultare i Termini di utilizzo.
Declinazione di responsabilità
Le informazioni e le pubblicazioni non sono intese come, e non costituiscono, consulenza o raccomandazioni finanziarie, di investimento, di trading o di altro tipo fornite o approvate da TradingView. Per ulteriori informazioni, consultare i Termini di utilizzo.