
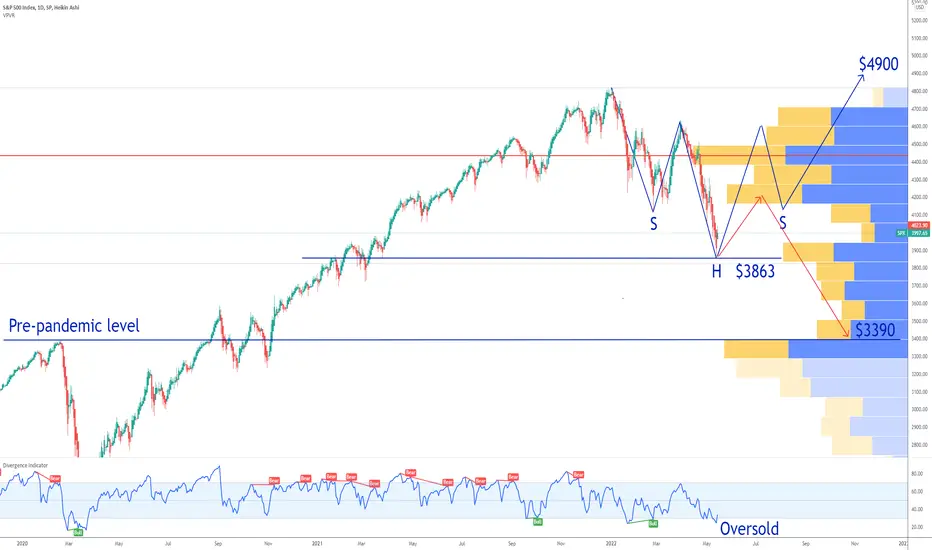
We are on the daily timeframe and we can see that historically buying the S&P index on RSI lower than 30 is an opportunity.
Current S&P 500 PE Ratio is decent: 20.34
Min: 5.31 (Dec 1917)
Max: 123.73 (May 2009)
I have 2 scenarios:
1. Inverse head and shoulders chart pattern with a price target of $4900 by the end of the year.
2. Worst case scenario: bull trap at $4150 an retracement to the pre-pandemic level of $3390. I tend not to believe this scenario because of the too low price per earnings ratio of the S&P.
Looking forward to read your opinion about it.
Current S&P 500 PE Ratio is decent: 20.34
Min: 5.31 (Dec 1917)
Max: 123.73 (May 2009)
I have 2 scenarios:
1. Inverse head and shoulders chart pattern with a price target of $4900 by the end of the year.
2. Worst case scenario: bull trap at $4150 an retracement to the pre-pandemic level of $3390. I tend not to believe this scenario because of the too low price per earnings ratio of the S&P.
Looking forward to read your opinion about it.

DAILY PRIVATE HIGH-CONVICTION OPTIONS SIGNALS: patreon.com/PremiumOptionsSignals
Trading COURSE bit.ly/tradex
RESULTS bit.ly/TG99x
CRYPTOS partner.bybit.com/b/37880
BUY-SELL INDICATORS tradingindicators.store/
Trading COURSE bit.ly/tradex
RESULTS bit.ly/TG99x
CRYPTOS partner.bybit.com/b/37880
BUY-SELL INDICATORS tradingindicators.store/
Declinazione di responsabilità
Le informazioni e le pubblicazioni non sono intese come, e non costituiscono, consulenza o raccomandazioni finanziarie, di investimento, di trading o di altro tipo fornite o approvate da TradingView. Per ulteriori informazioni, consultare i Termini di utilizzo.
DAILY PRIVATE HIGH-CONVICTION OPTIONS SIGNALS: patreon.com/PremiumOptionsSignals
Trading COURSE bit.ly/tradex
RESULTS bit.ly/TG99x
CRYPTOS partner.bybit.com/b/37880
BUY-SELL INDICATORS tradingindicators.store/
Trading COURSE bit.ly/tradex
RESULTS bit.ly/TG99x
CRYPTOS partner.bybit.com/b/37880
BUY-SELL INDICATORS tradingindicators.store/
Declinazione di responsabilità
Le informazioni e le pubblicazioni non sono intese come, e non costituiscono, consulenza o raccomandazioni finanziarie, di investimento, di trading o di altro tipo fornite o approvate da TradingView. Per ulteriori informazioni, consultare i Termini di utilizzo.