
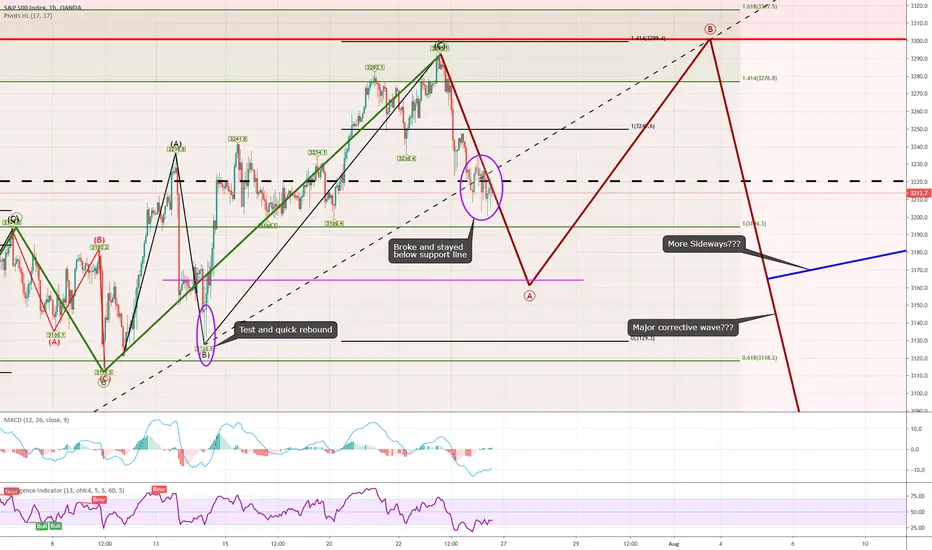
S&P 500 broke the support line yesterday and stayed under all day. This was not a test like previously. This is an indication that we are going to see a corrective wave sequence. A common pattern is for it to be symmetric about the support line for Wave A and Wave B to use the support line as a new resistance line. The height of Wave B is hard to know. I would guess around the previous ATH. Could go a touch higher if their is a enough momentum (max = 1.2 of Wave A). Not clear what comes after that for Wave C. It could be a small correction that will keep market going sideways or we could see a full corrective wave that could take us down to or past the March low.

Pubblicazioni correlate
Declinazione di responsabilità
Le informazioni e le pubblicazioni non sono intese come, e non costituiscono, consulenza o raccomandazioni finanziarie, di investimento, di trading o di altro tipo fornite o approvate da TradingView. Per ulteriori informazioni, consultare i Termini di utilizzo.
Pubblicazioni correlate
Declinazione di responsabilità
Le informazioni e le pubblicazioni non sono intese come, e non costituiscono, consulenza o raccomandazioni finanziarie, di investimento, di trading o di altro tipo fornite o approvate da TradingView. Per ulteriori informazioni, consultare i Termini di utilizzo.