
** The Golden Cross **
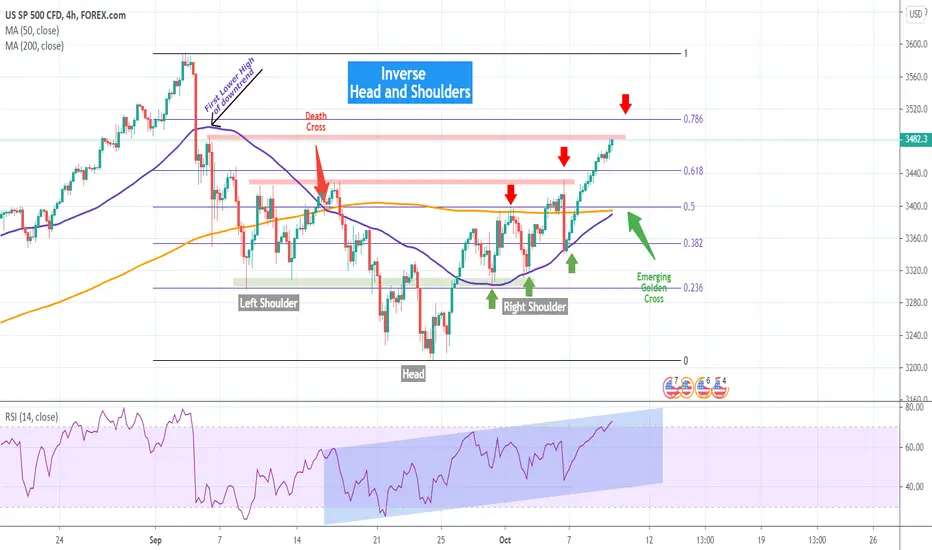
S&P just finished a very bullish week and on the 4H chart it is about to form a Golden Cross (MA50 crossing above the MA200). That will be the first time to see a 4H Golden Cross since April 15. That alone is a very bullish sign but it's not the only one we should consider.
** Symmetry on Inverse H&S and Fibonacci levels **
The main pattern was an Inverse Head and Shoulders, from which the price seems to be detaching from as S&P is recovering from September's fall. In fact so far the recovery seems to be symmetrical as the Highs and Lows of the September downtrend, seem to be filled quite accurately on the current uptrend. The Fibonacci retracement levels appear to be quite aligned.
The first Lower High of the downtrend (September 04) was at 3490. If that level is rejected (or at least leave a margin up to the 0.786 Fib), then it is possible to see a pull-back to the 4H MA50 (blue trend-line) as the Golden Cross is formed, in a similar way it did during the Death Cross (September 15). On any other occasion, it should be a straight rise to the All Time High.
Which of the two do you think it is going to be? Feel free to share your work and let me know in the comments section!
Most recent signal on S&P:
Please like, subscribe and share your ideas and charts with the community!
--------------------------------------------------------------------------------------------------------
!! Donations via TradingView coins also help me a great deal at posting more free trading content and signals here !!
🎉 👍 Shout-out to TradingShot's 💰 top TradingView Coin donor 💰 this week ==> AxelShadah
--------------------------------------------------------------------------------------------------------
S&P just finished a very bullish week and on the 4H chart it is about to form a Golden Cross (MA50 crossing above the MA200). That will be the first time to see a 4H Golden Cross since April 15. That alone is a very bullish sign but it's not the only one we should consider.
** Symmetry on Inverse H&S and Fibonacci levels **
The main pattern was an Inverse Head and Shoulders, from which the price seems to be detaching from as S&P is recovering from September's fall. In fact so far the recovery seems to be symmetrical as the Highs and Lows of the September downtrend, seem to be filled quite accurately on the current uptrend. The Fibonacci retracement levels appear to be quite aligned.
The first Lower High of the downtrend (September 04) was at 3490. If that level is rejected (or at least leave a margin up to the 0.786 Fib), then it is possible to see a pull-back to the 4H MA50 (blue trend-line) as the Golden Cross is formed, in a similar way it did during the Death Cross (September 15). On any other occasion, it should be a straight rise to the All Time High.
Which of the two do you think it is going to be? Feel free to share your work and let me know in the comments section!
Most recent signal on S&P:
Please like, subscribe and share your ideas and charts with the community!
--------------------------------------------------------------------------------------------------------
!! Donations via TradingView coins also help me a great deal at posting more free trading content and signals here !!
🎉 👍 Shout-out to TradingShot's 💰 top TradingView Coin donor 💰 this week ==> AxelShadah
--------------------------------------------------------------------------------------------------------

I trade Crypto, Forex, Indices & Commodities on PrimeXBT — all from one account with TradingView charts 👉 tradingshot.short.gy/PrimeXBT
I also use TradeNation for fixed spreads & zero commission 👉 tradingshot.short.gy/Tradenation
I also use TradeNation for fixed spreads & zero commission 👉 tradingshot.short.gy/Tradenation
Declinazione di responsabilità
Le informazioni e le pubblicazioni non sono intese come, e non costituiscono, consulenza o raccomandazioni finanziarie, di investimento, di trading o di altro tipo fornite o approvate da TradingView. Per ulteriori informazioni, consultare i Termini di utilizzo.
I trade Crypto, Forex, Indices & Commodities on PrimeXBT — all from one account with TradingView charts 👉 tradingshot.short.gy/PrimeXBT
I also use TradeNation for fixed spreads & zero commission 👉 tradingshot.short.gy/Tradenation
I also use TradeNation for fixed spreads & zero commission 👉 tradingshot.short.gy/Tradenation
Declinazione di responsabilità
Le informazioni e le pubblicazioni non sono intese come, e non costituiscono, consulenza o raccomandazioni finanziarie, di investimento, di trading o di altro tipo fornite o approvate da TradingView. Per ulteriori informazioni, consultare i Termini di utilizzo.