
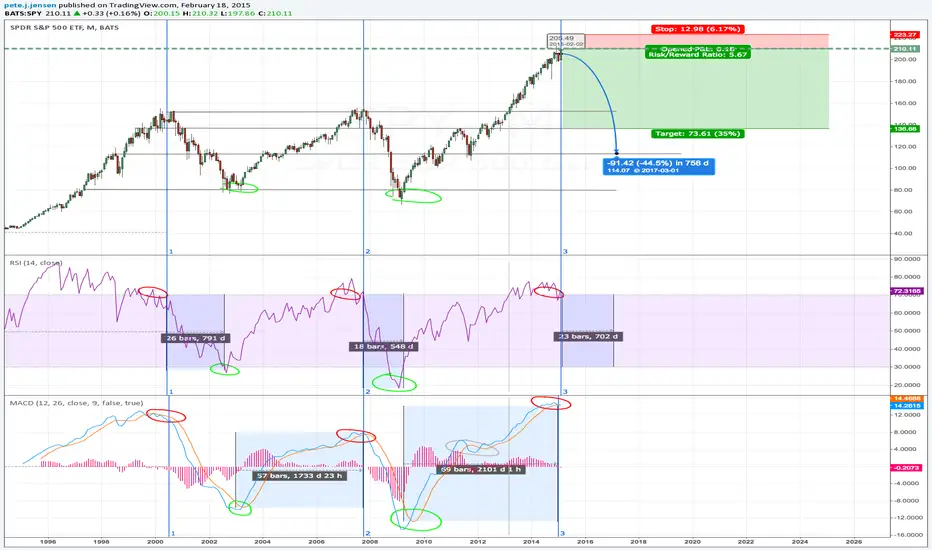
The stars are aligning for a pretty serious pullback in the US Equities Market.
The chart uses my two favorite indicators; RSI and MACD.
I've gone through and marked historical correlations on the chart for prior crashes for both indicators.
RSI going above 70; signals overvalued
RSI going below 30; signals underbought
MACD Converging (Red)
MACD Diverging (Green)
You'll see both of these correlate quite nicely with the two previous crashes.
**Projections**
I project a between a 30-40 percent pull back spanning nearly two years.
I've added a possible short position with a fairly tight tolerance for a good ratio.
I'll keep the chart updated in case we're looking at a false-top; given present valuations and P/E ratios I don't think we are.
The chart uses my two favorite indicators; RSI and MACD.
I've gone through and marked historical correlations on the chart for prior crashes for both indicators.
RSI going above 70; signals overvalued
RSI going below 30; signals underbought
MACD Converging (Red)
MACD Diverging (Green)
You'll see both of these correlate quite nicely with the two previous crashes.
**Projections**
I project a between a 30-40 percent pull back spanning nearly two years.
I've added a possible short position with a fairly tight tolerance for a good ratio.
I'll keep the chart updated in case we're looking at a false-top; given present valuations and P/E ratios I don't think we are.

Declinazione di responsabilità
Le informazioni e le pubblicazioni non sono intese come, e non costituiscono, consulenza o raccomandazioni finanziarie, di investimento, di trading o di altro tipo fornite o approvate da TradingView. Per ulteriori informazioni, consultare i Termini di utilizzo.
Declinazione di responsabilità
Le informazioni e le pubblicazioni non sono intese come, e non costituiscono, consulenza o raccomandazioni finanziarie, di investimento, di trading o di altro tipo fornite o approvate da TradingView. Per ulteriori informazioni, consultare i Termini di utilizzo.