
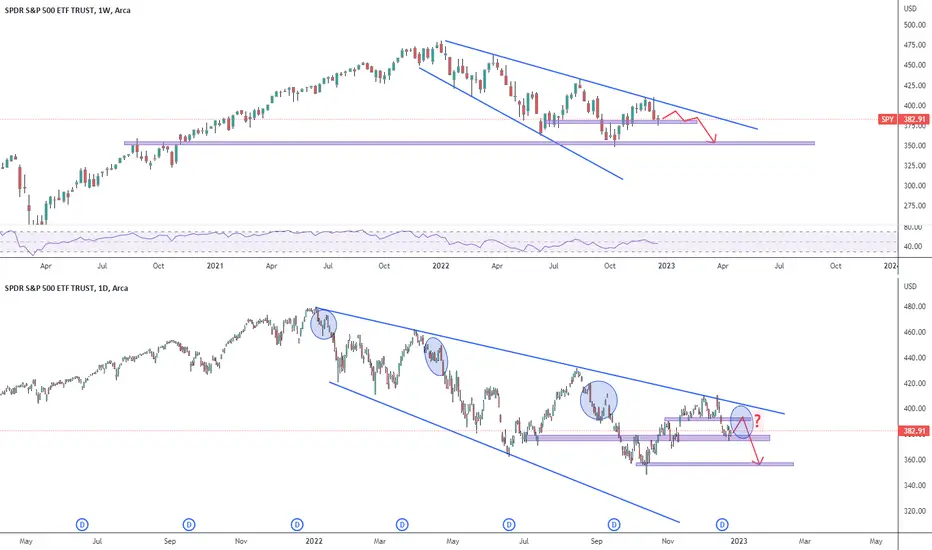
Top chart weekly timeframe, bottom chart daily timeframe. Price action on the top chart shows a Long Legged Doji candle at the $380 important support level. I think we will see a short term rally, retest the previous support now resistance $390 and then crash to the downside. I'm just waiting for the retest to open a short position.

Declinazione di responsabilità
Le informazioni e le pubblicazioni non sono intese come, e non costituiscono, consulenza o raccomandazioni finanziarie, di investimento, di trading o di altro tipo fornite o approvate da TradingView. Per ulteriori informazioni, consultare i Termini di utilizzo.
Declinazione di responsabilità
Le informazioni e le pubblicazioni non sono intese come, e non costituiscono, consulenza o raccomandazioni finanziarie, di investimento, di trading o di altro tipo fornite o approvate da TradingView. Per ulteriori informazioni, consultare i Termini di utilizzo.