
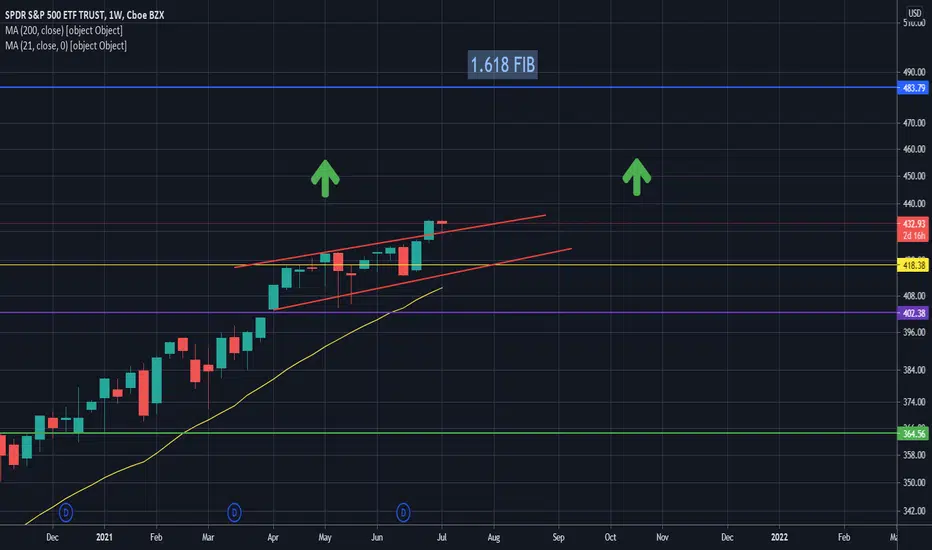
As what should be no surprise, the S&P 500 has found itself on the verge of breaking bullish out of another bearish ascending channel.
Typically, when price action breaks bullish out of a bearish pattern the moves are very powerful.
This brings us to exhibit A on the weekly chart. A decisive breakout occurred last week and now this week currently looks to be attempting to confirm a full body candle close with a confirmed backtest of the upper channel support just for good measure. And if it holds, SPY could run up in price double digits of percentages to the nearest fib extension at 483.79 approximately.
The second half of the year might be a big one for equities overall, and the technicals (at least short to medium term) seem to be reflecting that.
Typically, when price action breaks bullish out of a bearish pattern the moves are very powerful.
This brings us to exhibit A on the weekly chart. A decisive breakout occurred last week and now this week currently looks to be attempting to confirm a full body candle close with a confirmed backtest of the upper channel support just for good measure. And if it holds, SPY could run up in price double digits of percentages to the nearest fib extension at 483.79 approximately.
The second half of the year might be a big one for equities overall, and the technicals (at least short to medium term) seem to be reflecting that.

Declinazione di responsabilità
Le informazioni e le pubblicazioni non sono intese come, e non costituiscono, consulenza o raccomandazioni finanziarie, di investimento, di trading o di altro tipo fornite o approvate da TradingView. Per ulteriori informazioni, consultare i Termini di utilizzo.
Declinazione di responsabilità
Le informazioni e le pubblicazioni non sono intese come, e non costituiscono, consulenza o raccomandazioni finanziarie, di investimento, di trading o di altro tipo fornite o approvate da TradingView. Per ulteriori informazioni, consultare i Termini di utilizzo.