
SPY – Dec 26 Trading Outlook | Trend Support vs Gamma Ceiling
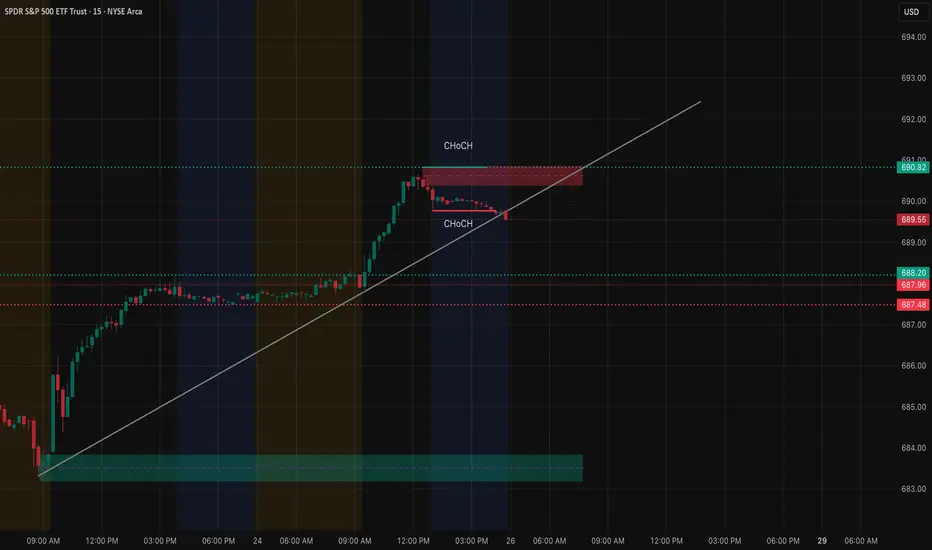
it’s now pressing into a zone where trend structure and GEX start to conflict. Tomorrow is about whether this pullback is a pause for continuation or the start of a deeper mean reversion.
Price action / structure (15m) SPY remains in an intraday uptrend, respecting the rising trendline from the recent lows. However, the most recent push into the highs produced a clear CHoCH at the top, followed by rejection and consolidation just below resistance.
Price is currently compressing between the rising trendline and overhead supply. Momentum has slowed, and candles are getting smaller — typical behavior ahead of either a continuation breakout or a trendline failure.
Importantly, this is not aggressive selling. It’s controlled digestion.
Key levels to watch Major resistance / supply: 690.8–691.0 This zone rejected price cleanly and aligns with the highest positive NETGEX / call resistance. Acceptance above this level is required for trend continuation.
Range pivot: 689.5–689.0 This is the balance point. As long as SPY holds above this zone, bulls still have control.
Trend support / line in the sand: 688.2–687.8 Loss of this area breaks the rising trend structure and likely shifts the day into a corrective move.
Downside magnet: 686.0–685.0 If trend support fails, this zone becomes the next high-probability draw, aligning with prior demand and lower GEX support.
GEX / options context GEX is very clear here.

690 is the dominant gamma wall and highest positive NETGEX level. This explains why price stalled immediately after tagging it. Dealers are incentivized to keep SPY below this level into short-dated expiration.
Below price, gamma support is lighter until the mid-680s. That means if the trendline breaks, downside movement can accelerate faster than recent buyers expect.
IV remains compressed, and options positioning favors pinning rather than expansion unless price breaks cleanly above 691.
Scenarios for tomorrow
Bullish continuation scenario SPY holds above 689 and breaks through 691 with acceptance and volume. If that happens, continuation toward 693–695 becomes viable, supported by trend strength and forced dealer hedging.
Bearish / corrective scenario Failure to hold 688 followed by acceptance below the trendline opens the door to 686 first, potentially 685. This would be a controlled pullback, not a crash.
Chop scenario If SPY stays between 689–691, expect frustrating chop and premium decay. This is the most likely outcome if volume remains muted.
Options thoughts Avoid chasing premium inside the range.
More favorable setups: Calls only on acceptance above 691 Puts only after confirmed loss of 688 and failed retest
Scalpers should focus on reactions at trendline and gamma levels rather than predicting direction.
Overall bias Cautiously bullish while above trend support, but upside is capped until 691 breaks cleanly. SPY is strong, but it’s pressing directly into a gamma ceiling.
Hold the trend → continuation possible. Lose the trend → clean pullback setup.
This analysis is for educational purposes only and does not constitute financial advice. Always manage risk and trade your own plan.
Price action / structure (15m) SPY remains in an intraday uptrend, respecting the rising trendline from the recent lows. However, the most recent push into the highs produced a clear CHoCH at the top, followed by rejection and consolidation just below resistance.
Price is currently compressing between the rising trendline and overhead supply. Momentum has slowed, and candles are getting smaller — typical behavior ahead of either a continuation breakout or a trendline failure.
Importantly, this is not aggressive selling. It’s controlled digestion.
Key levels to watch Major resistance / supply: 690.8–691.0 This zone rejected price cleanly and aligns with the highest positive NETGEX / call resistance. Acceptance above this level is required for trend continuation.
Range pivot: 689.5–689.0 This is the balance point. As long as SPY holds above this zone, bulls still have control.
Trend support / line in the sand: 688.2–687.8 Loss of this area breaks the rising trend structure and likely shifts the day into a corrective move.
Downside magnet: 686.0–685.0 If trend support fails, this zone becomes the next high-probability draw, aligning with prior demand and lower GEX support.
GEX / options context GEX is very clear here.
690 is the dominant gamma wall and highest positive NETGEX level. This explains why price stalled immediately after tagging it. Dealers are incentivized to keep SPY below this level into short-dated expiration.
Below price, gamma support is lighter until the mid-680s. That means if the trendline breaks, downside movement can accelerate faster than recent buyers expect.
IV remains compressed, and options positioning favors pinning rather than expansion unless price breaks cleanly above 691.
Scenarios for tomorrow
Bullish continuation scenario SPY holds above 689 and breaks through 691 with acceptance and volume. If that happens, continuation toward 693–695 becomes viable, supported by trend strength and forced dealer hedging.
Bearish / corrective scenario Failure to hold 688 followed by acceptance below the trendline opens the door to 686 first, potentially 685. This would be a controlled pullback, not a crash.
Chop scenario If SPY stays between 689–691, expect frustrating chop and premium decay. This is the most likely outcome if volume remains muted.
Options thoughts Avoid chasing premium inside the range.
More favorable setups: Calls only on acceptance above 691 Puts only after confirmed loss of 688 and failed retest
Scalpers should focus on reactions at trendline and gamma levels rather than predicting direction.
Overall bias Cautiously bullish while above trend support, but upside is capped until 691 breaks cleanly. SPY is strong, but it’s pressing directly into a gamma ceiling.
Hold the trend → continuation possible. Lose the trend → clean pullback setup.
This analysis is for educational purposes only and does not constitute financial advice. Always manage risk and trade your own plan.

Built for traders who want clarity, not noise.
bullbearxinsights.app
bullbearxinsights.app
Declinazione di responsabilità
Le informazioni e le pubblicazioni non sono intese come, e non costituiscono, consulenza o raccomandazioni finanziarie, di investimento, di trading o di altro tipo fornite o approvate da TradingView. Per ulteriori informazioni, consultare i Termini di utilizzo.
Built for traders who want clarity, not noise.
bullbearxinsights.app
bullbearxinsights.app
Declinazione di responsabilità
Le informazioni e le pubblicazioni non sono intese come, e non costituiscono, consulenza o raccomandazioni finanziarie, di investimento, di trading o di altro tipo fornite o approvate da TradingView. Per ulteriori informazioni, consultare i Termini di utilizzo.