
The Macro Picture 🗺️
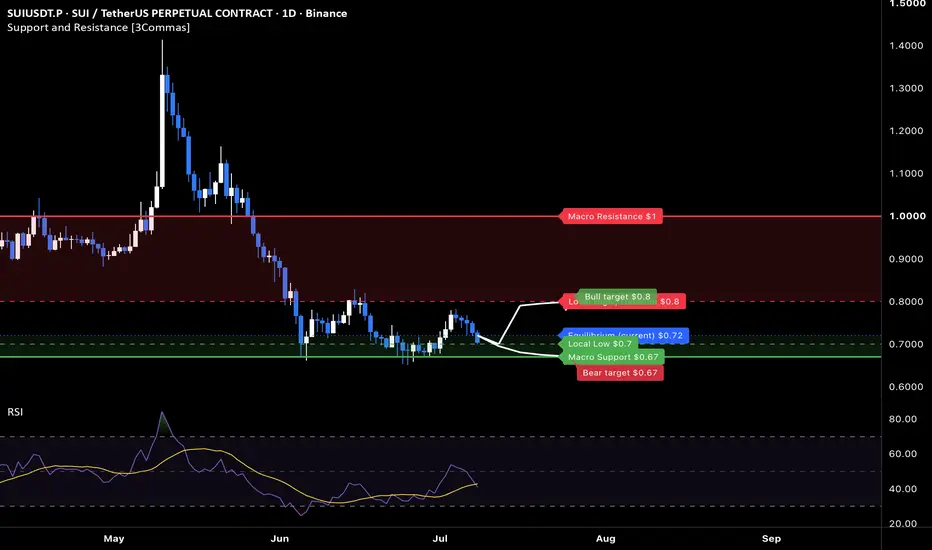
SUI blew off in a May spike to $1.42 before that parabolic move fully unwound, bleeding back down through the $1.00 shelf and into a $0.67 low. Since June, the selling has dried up: price has compressed into a tight range between the $0.67 floor and the $0.80 local cap, coiling near the $0.72 equilibrium. RSI sits around neutral, confirming the post-spike hangover has given way to balance. This kind of low-volatility base after a full retrace is where accumulation quietly builds — the market has reset, and the next expansion waits on a break of either edge.
The Setup ⚙️
The Floor: The $0.67 macro support (solid green) has held every retest since June, stacking with the $0.70 local low to form a high-confluence demand shelf. This is the line bulls must keep defending to preserve the base.
The Ceiling: The $0.80 local decision (red dashed) caps the range. A decisive daily close above it would break the coil and put the heavier $1.00 supply band — the old base — back in view.
The Range Play: The $0.70–$0.72 band creates a structural playground for grid-based accumulation — mechanical entries stacked across the range while price coils, no directional call required until the break confirms.
The Roadmap: Primary target sits at $0.80 — the green roadmap points toward a rotation to the range ceiling as buyers hold the floor. Invalidation: a sustained 1D close below $0.67 would break the base and reopen the downtrend toward fresh lows.
More setups in profile.
SUI blew off in a May spike to $1.42 before that parabolic move fully unwound, bleeding back down through the $1.00 shelf and into a $0.67 low. Since June, the selling has dried up: price has compressed into a tight range between the $0.67 floor and the $0.80 local cap, coiling near the $0.72 equilibrium. RSI sits around neutral, confirming the post-spike hangover has given way to balance. This kind of low-volatility base after a full retrace is where accumulation quietly builds — the market has reset, and the next expansion waits on a break of either edge.
The Setup ⚙️
The Floor: The $0.67 macro support (solid green) has held every retest since June, stacking with the $0.70 local low to form a high-confluence demand shelf. This is the line bulls must keep defending to preserve the base.
The Ceiling: The $0.80 local decision (red dashed) caps the range. A decisive daily close above it would break the coil and put the heavier $1.00 supply band — the old base — back in view.
The Range Play: The $0.70–$0.72 band creates a structural playground for grid-based accumulation — mechanical entries stacked across the range while price coils, no directional call required until the break confirms.
The Roadmap: Primary target sits at $0.80 — the green roadmap points toward a rotation to the range ceiling as buyers hold the floor. Invalidation: a sustained 1D close below $0.67 would break the base and reopen the downtrend toward fresh lows.
More setups in profile.

📈 Stop guessing your settings — backtest & optimize with QuantPilot
🎁 Free to start
🎁 Free to start
Declinazione di responsabilità
Le informazioni e le pubblicazioni non sono intese come, e non costituiscono, consulenza o raccomandazioni finanziarie, di investimento, di trading o di altro tipo fornite o approvate da TradingView. Per ulteriori informazioni, consultare i Termini di utilizzo.
📈 Stop guessing your settings — backtest & optimize with QuantPilot
🎁 Free to start
🎁 Free to start
Declinazione di responsabilità
Le informazioni e le pubblicazioni non sono intese come, e non costituiscono, consulenza o raccomandazioni finanziarie, di investimento, di trading o di altro tipo fornite o approvate da TradingView. Per ulteriori informazioni, consultare i Termini di utilizzo.