
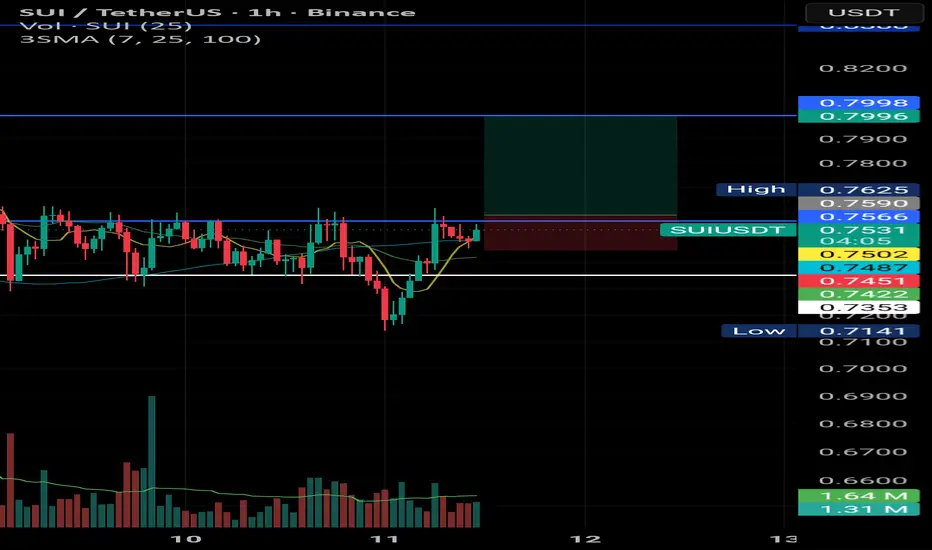
After a fake breakdown below the range low at 0.7353, price managed to reclaim the range and is now testing the 0.7566 resistance level.
A breakout above this level would complete a V-shaped recovery and could increase the probability of further upside.
Momentum indicators are showing signs of strengthening, with RSI moving toward the overbought region, suggesting growing buying pressure.
In this scenario, the next key levels to watch are 0.7998 and 0.8388.
A breakout above this level would complete a V-shaped recovery and could increase the probability of further upside.
Momentum indicators are showing signs of strengthening, with RSI moving toward the overbought region, suggesting growing buying pressure.
In this scenario, the next key levels to watch are 0.7998 and 0.8388.

Declinazione di responsabilità
Le informazioni e le pubblicazioni non sono intese come, e non costituiscono, consulenza o raccomandazioni finanziarie, di investimento, di trading o di altro tipo fornite o approvate da TradingView. Per ulteriori informazioni, consultare i Termini di utilizzo.
Declinazione di responsabilità
Le informazioni e le pubblicazioni non sono intese come, e non costituiscono, consulenza o raccomandazioni finanziarie, di investimento, di trading o di altro tipo fornite o approvate da TradingView. Per ulteriori informazioni, consultare i Termini di utilizzo.