
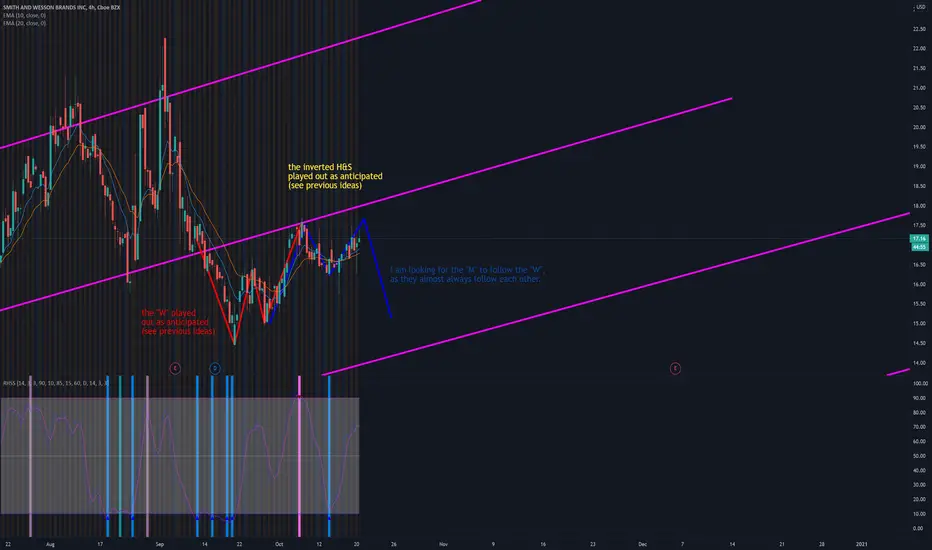
trading off the 10 & 20 EMAs, the daily is about to confirm the retest and signal an uptrend on the daily (green candle closing above the EMA cloud with the 10 over the 20) which could easily invalidate the idea published here: breaking down the right side of the blue "M".
If the "M" does play our as depicted, it will simply paint a larger "W" with an upside around $20, the resistance from our most recent major high.
If the "M" does play our as depicted, it will simply paint a larger "W" with an upside around $20, the resistance from our most recent major high.
Trade chiuso: obiettivo raggiunto
the M ran to its bottom against the lower side of the current channel.
Declinazione di responsabilità
Le informazioni e le pubblicazioni non sono intese come, e non costituiscono, consulenza o raccomandazioni finanziarie, di investimento, di trading o di altro tipo fornite o approvate da TradingView. Per ulteriori informazioni, consultare i Termini di utilizzo.
Declinazione di responsabilità
Le informazioni e le pubblicazioni non sono intese come, e non costituiscono, consulenza o raccomandazioni finanziarie, di investimento, di trading o di altro tipo fornite o approvate da TradingView. Per ulteriori informazioni, consultare i Termini di utilizzo.