SXP - The Parabolic Curve
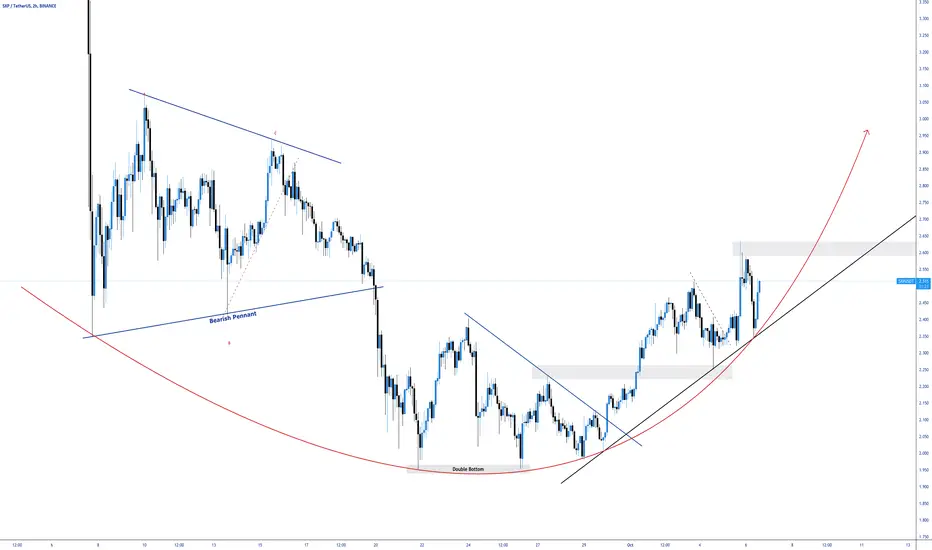
In our last SXP analysis we were short from the bearish pennant. We met our -0.27 fibonacci target and turned bullish.
We saw a double bottom indicating that price is reversing. We also have what looks to be a parabolic curve support. Watching for the next retest of the trendline or structure for another move up!
We saw a double bottom indicating that price is reversing. We also have what looks to be a parabolic curve support. Watching for the next retest of the trendline or structure for another move up!

🥃 Crypto Signals Since 2017 🥃
💎Telegram t.me/AltSignals 💎
📈 Signals/Algos altsignals.io/join 📈
💎Telegram t.me/AltSignals 💎
📈 Signals/Algos altsignals.io/join 📈
Declinazione di responsabilità
Le informazioni e le pubblicazioni non sono intese come, e non costituiscono, consulenza o raccomandazioni finanziarie, di investimento, di trading o di altro tipo fornite o approvate da TradingView. Per ulteriori informazioni, consultare i Termini di utilizzo.
🥃 Crypto Signals Since 2017 🥃
💎Telegram t.me/AltSignals 💎
📈 Signals/Algos altsignals.io/join 📈
💎Telegram t.me/AltSignals 💎
📈 Signals/Algos altsignals.io/join 📈
Declinazione di responsabilità
Le informazioni e le pubblicazioni non sono intese come, e non costituiscono, consulenza o raccomandazioni finanziarie, di investimento, di trading o di altro tipo fornite o approvate da TradingView. Per ulteriori informazioni, consultare i Termini di utilizzo.