
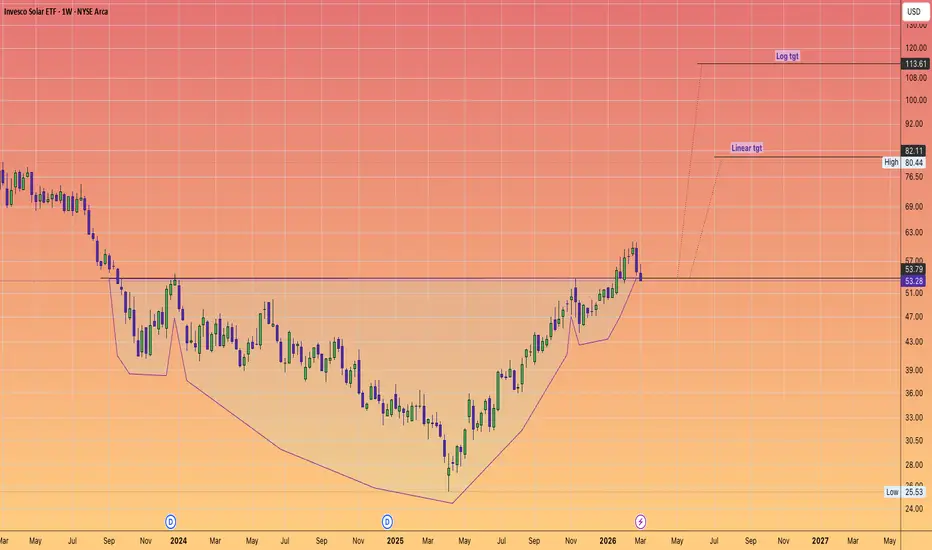
The Pattern Setup:
Left Shoulder: Formed during the late January dip (approx. $51.00 - $52.00).
The Head: The deeper washout seen in late February/early March, potentially hitting a low near the $50.48 mark.
Right Shoulder: Currently forming or anticipated as price stabilizes above the $51.51 support zone.
The Neckline: Likely a horizontal or slightly descending line connecting the peaks near $58.00 - $59.00.
The Why:
The geopolitical drivers behind the current oil spike (March 2026) can be condensed into four critical "shocks" that have removed millions of barrels from the global supply chain.
🔌 The Four Geopolitical Shocks
The Hormuz Blockade: Following #U.S./ #Israeli strikes on Feb 28, the Strait of Hormuz is effectively closed. This chokepoint handles 20% of global #oil (20 million bpd).
Shipping traffic has plummeted by 95%, leaving nearly 600 vessels stranded or rerouted.
Infrastructure Retaliation: Conflict has moved beyond sanctions to physical destruction. Iranian drone and missile strikes have damaged refineries and ports in Saudi Arabia, Qatar, and Kuwait, forcing regional producers to slash output as they run out of storage.
Sanctions "U-Turn": To combat $90+ oil, the U.S. has eased sanctions on Russian oil (specifically for India) to provide a "relief valve," while simultaneously imposing 25% secondary tariffs on nations still trading with Iran’s shadow fleet.
OPEC+ Paralysis: While OPEC+ recently agreed to a modest production hike for April, the kinetic war in the Gulf makes it nearly impossible for members to export that extra capacity safely.
📉 Impact Analysis: Price vs. Duration
The market is currently pricing in a "4-5 week" conflict timeline as projected by the U.S. Administration.
Global Economic Impact
Current (March 8) $94 / bbl Surge in shipping costs (+$1,800 per container).
Mid-Term (4-6 Weeks) $100 - $110 Significant "cost-push" inflation; SPR releases begin.
Long-Term (3+ Months) $150+ Global #recession; force majeure on Gulf LNG/Oil contracts.
Left Shoulder: Formed during the late January dip (approx. $51.00 - $52.00).
The Head: The deeper washout seen in late February/early March, potentially hitting a low near the $50.48 mark.
Right Shoulder: Currently forming or anticipated as price stabilizes above the $51.51 support zone.
The Neckline: Likely a horizontal or slightly descending line connecting the peaks near $58.00 - $59.00.
The Why:
The geopolitical drivers behind the current oil spike (March 2026) can be condensed into four critical "shocks" that have removed millions of barrels from the global supply chain.
🔌 The Four Geopolitical Shocks
The Hormuz Blockade: Following #U.S./ #Israeli strikes on Feb 28, the Strait of Hormuz is effectively closed. This chokepoint handles 20% of global #oil (20 million bpd).
Shipping traffic has plummeted by 95%, leaving nearly 600 vessels stranded or rerouted.
Infrastructure Retaliation: Conflict has moved beyond sanctions to physical destruction. Iranian drone and missile strikes have damaged refineries and ports in Saudi Arabia, Qatar, and Kuwait, forcing regional producers to slash output as they run out of storage.
Sanctions "U-Turn": To combat $90+ oil, the U.S. has eased sanctions on Russian oil (specifically for India) to provide a "relief valve," while simultaneously imposing 25% secondary tariffs on nations still trading with Iran’s shadow fleet.
OPEC+ Paralysis: While OPEC+ recently agreed to a modest production hike for April, the kinetic war in the Gulf makes it nearly impossible for members to export that extra capacity safely.
📉 Impact Analysis: Price vs. Duration
The market is currently pricing in a "4-5 week" conflict timeline as projected by the U.S. Administration.
Global Economic Impact
Current (March 8) $94 / bbl Surge in shipping costs (+$1,800 per container).
Mid-Term (4-6 Weeks) $100 - $110 Significant "cost-push" inflation; SPR releases begin.
Long-Term (3+ Months) $150+ Global #recession; force majeure on Gulf LNG/Oil contracts.

Declinazione di responsabilità
Le informazioni e le pubblicazioni non sono intese come, e non costituiscono, consulenza o raccomandazioni finanziarie, di investimento, di trading o di altro tipo fornite o approvate da TradingView. Per ulteriori informazioni, consultare i Termini di utilizzo.
Declinazione di responsabilità
Le informazioni e le pubblicazioni non sono intese come, e non costituiscono, consulenza o raccomandazioni finanziarie, di investimento, di trading o di altro tipo fornite o approvate da TradingView. Per ulteriori informazioni, consultare i Termini di utilizzo.