TCT falling wedge
#TCTBTC
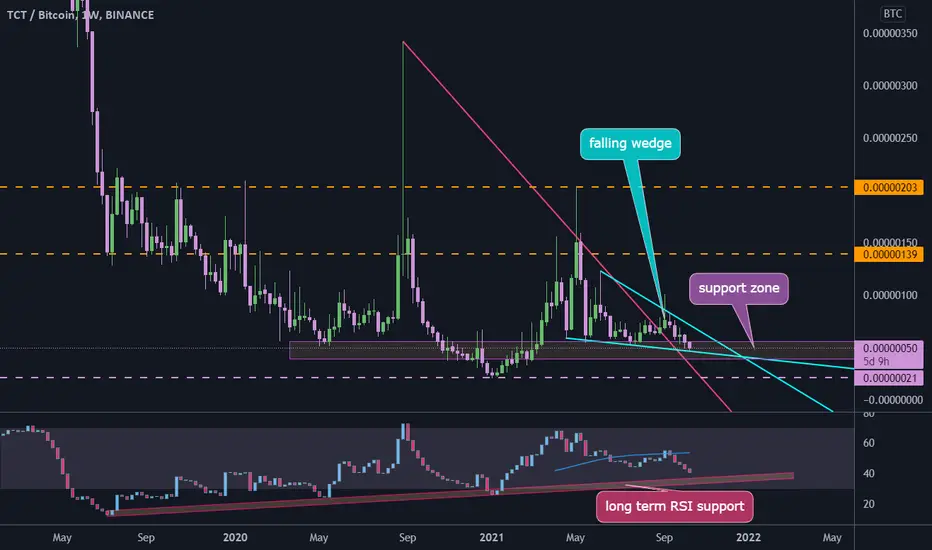
#TCT with BTC pair shows a falling wedge pattern in daily time frame, we can see that price broke out from descending resistance line and going down near this line, there is a long term support zone in RSI that shows price may fall more to touch it one more time then head up and break the wedge pattern.
#TCT with BTC pair shows a falling wedge pattern in daily time frame, we can see that price broke out from descending resistance line and going down near this line, there is a long term support zone in RSI that shows price may fall more to touch it one more time then head up and break the wedge pattern.

Declinazione di responsabilità
Le informazioni e le pubblicazioni non sono intese come, e non costituiscono, consulenza o raccomandazioni finanziarie, di investimento, di trading o di altro tipo fornite o approvate da TradingView. Per ulteriori informazioni, consultare i Termini di utilizzo.
Declinazione di responsabilità
Le informazioni e le pubblicazioni non sono intese come, e non costituiscono, consulenza o raccomandazioni finanziarie, di investimento, di trading o di altro tipo fornite o approvate da TradingView. Per ulteriori informazioni, consultare i Termini di utilizzo.