
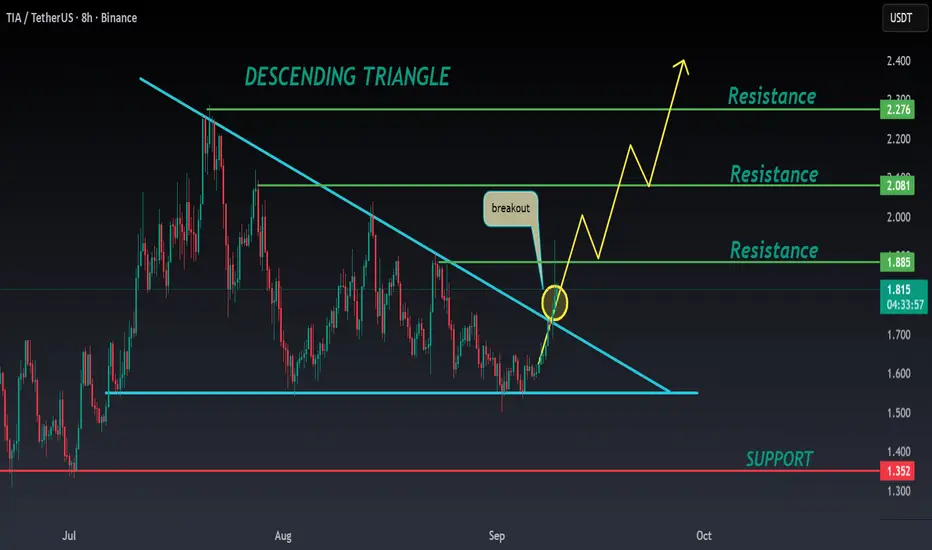
🚀#TIA Analysis : What Next ??💲💲
✅As we can see that there was a formation of Descending Triangle Pattern in #TIA and given a breakout. We are expecting around more than 30% bullish move in coming weeks 📈📈
🔰Current Price: $1.815
🎯 Target Price: $2.081
⚡️What to do ?
👀Keep an eye on #TIA price action. We can trade according to the chart and make some profits. Stay tuned for further analysis and stay updated with market sentiments and news.⚡️⚡️
#TIA #Cryptocurrency #TechnicalAnalysis #DYOR
✅As we can see that there was a formation of Descending Triangle Pattern in #TIA and given a breakout. We are expecting around more than 30% bullish move in coming weeks 📈📈
🔰Current Price: $1.815
🎯 Target Price: $2.081
⚡️What to do ?
👀Keep an eye on #TIA price action. We can trade according to the chart and make some profits. Stay tuned for further analysis and stay updated with market sentiments and news.⚡️⚡️
#TIA #Cryptocurrency #TechnicalAnalysis #DYOR

Become profitable trader!
Try our channels for Crypto Signals, Alerts and Secret Indicators
linktr.ee/zeus_market_alerts
Join our FREE Channel On Telegram linktr.ee/zeus_market_alerts
Try our channels for Crypto Signals, Alerts and Secret Indicators
linktr.ee/zeus_market_alerts
Join our FREE Channel On Telegram linktr.ee/zeus_market_alerts
Pubblicazioni correlate
Declinazione di responsabilità
Le informazioni e le pubblicazioni non sono intese come, e non costituiscono, consulenza o raccomandazioni finanziarie, di investimento, di trading o di altro tipo fornite o approvate da TradingView. Per ulteriori informazioni, consultare i Termini di utilizzo.
Become profitable trader!
Try our channels for Crypto Signals, Alerts and Secret Indicators
linktr.ee/zeus_market_alerts
Join our FREE Channel On Telegram linktr.ee/zeus_market_alerts
Try our channels for Crypto Signals, Alerts and Secret Indicators
linktr.ee/zeus_market_alerts
Join our FREE Channel On Telegram linktr.ee/zeus_market_alerts
Pubblicazioni correlate
Declinazione di responsabilità
Le informazioni e le pubblicazioni non sono intese come, e non costituiscono, consulenza o raccomandazioni finanziarie, di investimento, di trading o di altro tipo fornite o approvate da TradingView. Per ulteriori informazioni, consultare i Termini di utilizzo.