
MARKET-BEATING SCORE = 5/10
TKNO | Alpha Teknova, Inc.
"engages in the manufacture of cell culture media and supplements. It provides reagents that enable the discovery, development, and production of biopharmaceutical products such as drug therapies, novel vaccines, and molecular diagnostics. Its product offerings include pre-poured media plates for cell growth and cloning, liquid cell culture media and supplements for cellular expansion, and molecular biology reagents for sample manipulation, resuspension, and purification"
Located in: Hollister, CA.
------------------------------
MARKET-BEATING SCORE
TKNO PEGY -0.52 — undervalued vs. growth rate. Strong candidate to beat the market.
TKNO EPS growth 19.65% — solid, in line with market leaders.
TKNO revenue growing 9.30% YoY — steady but below high-growth threshold (15%+).
TKNO gross margin 34.01% — decent margin, competitive business model.
TKNO FCF $-9.07M negative — cash burn is a risk factor against market-beating returns.
TKNO D/E ratio 0.43 — conservative leverage, balance sheet resilience favors outperformance.
-------------------------
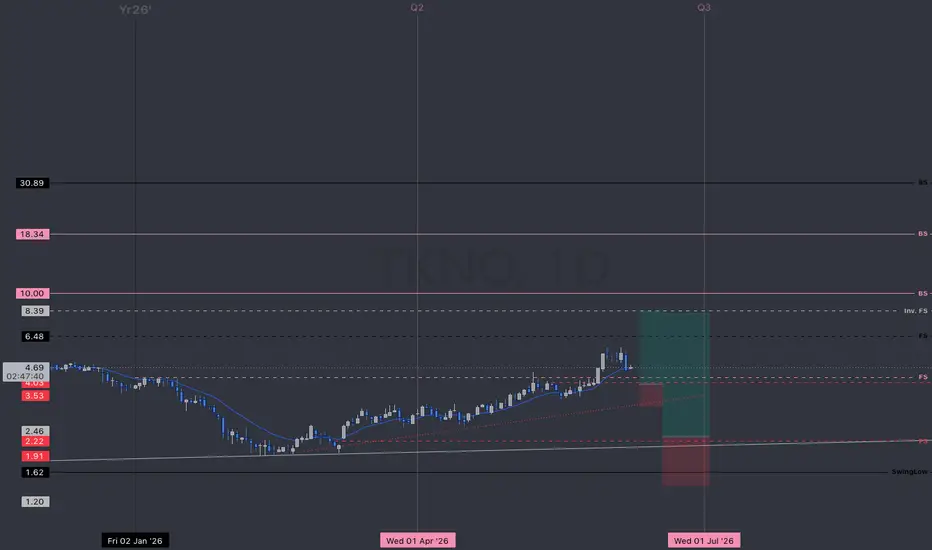
Multiple Time-Frame Analysis; Color Code | Strength favors the higher timeframe.
Yearly timeframe = black
Monthly timeframe = pink
weekly = grey
daily = red
4hr = orange
1hr = yellow
15min = blue
5min = green if they are shown. (Level visibility on intervals is set to timeframe the level was found on and below to keep chart view organized.)
** Candle Science explained **
A Range = two or more consecutive color candles.
There are two types of ranges - accumulation and distribution.
DISTRIBUTION RANGES DEFINED: BackSide (BS) Candle - First distribution candle in a distribution range. Expectation = strong reaction to price. long wicks reaching to or away from level.
FrontSide (FS) Candle - Last distribution candle in a distribution range. Expectation = reversal, create a trend in the opposite direction. Distribution candles are used as support.
ACCUMULATION RANGES DEFINED:
Inverse BS (Inv.BS) - First Accumulation candle in an accumulation range. Expectation. = strong reaction to price. long wicks reaching to or away from level.
Inverse FS (Inv.FS) - Last accumulation candle in an accumulation range. Expectation = reversal, create a trend in the opposite direction. Accumulation candles are used as resistance.
Horizontal Ray tool on BS & FS levels are default support levels when dashed lines, tested when dotted lines and resistance when solid lines.
Horizontal Ray tool on Inverse BS & Inverse FS levels default as resistance and shown with a dashed line, tested when 1x dotted line, and support when solid line.
The inverse is true for the Inv. BS Inv. FS levels, they are resistance as dashed lines, tested as dotted and support as solid lines.
TKNO | Alpha Teknova, Inc.
"engages in the manufacture of cell culture media and supplements. It provides reagents that enable the discovery, development, and production of biopharmaceutical products such as drug therapies, novel vaccines, and molecular diagnostics. Its product offerings include pre-poured media plates for cell growth and cloning, liquid cell culture media and supplements for cellular expansion, and molecular biology reagents for sample manipulation, resuspension, and purification"
Located in: Hollister, CA.
------------------------------
MARKET-BEATING SCORE
TKNO PEGY -0.52 — undervalued vs. growth rate. Strong candidate to beat the market.
TKNO EPS growth 19.65% — solid, in line with market leaders.
TKNO revenue growing 9.30% YoY — steady but below high-growth threshold (15%+).
TKNO gross margin 34.01% — decent margin, competitive business model.
TKNO FCF $-9.07M negative — cash burn is a risk factor against market-beating returns.
TKNO D/E ratio 0.43 — conservative leverage, balance sheet resilience favors outperformance.
-------------------------
Multiple Time-Frame Analysis; Color Code | Strength favors the higher timeframe.
Yearly timeframe = black
Monthly timeframe = pink
weekly = grey
daily = red
4hr = orange
1hr = yellow
15min = blue
5min = green if they are shown. (Level visibility on intervals is set to timeframe the level was found on and below to keep chart view organized.)
** Candle Science explained **
A Range = two or more consecutive color candles.
There are two types of ranges - accumulation and distribution.
DISTRIBUTION RANGES DEFINED: BackSide (BS) Candle - First distribution candle in a distribution range. Expectation = strong reaction to price. long wicks reaching to or away from level.
FrontSide (FS) Candle - Last distribution candle in a distribution range. Expectation = reversal, create a trend in the opposite direction. Distribution candles are used as support.
ACCUMULATION RANGES DEFINED:
Inverse BS (Inv.BS) - First Accumulation candle in an accumulation range. Expectation. = strong reaction to price. long wicks reaching to or away from level.
Inverse FS (Inv.FS) - Last accumulation candle in an accumulation range. Expectation = reversal, create a trend in the opposite direction. Accumulation candles are used as resistance.
Horizontal Ray tool on BS & FS levels are default support levels when dashed lines, tested when dotted lines and resistance when solid lines.
Horizontal Ray tool on Inverse BS & Inverse FS levels default as resistance and shown with a dashed line, tested when 1x dotted line, and support when solid line.
The inverse is true for the Inv. BS Inv. FS levels, they are resistance as dashed lines, tested as dotted and support as solid lines.
Trade attivo
Don't set entry below the level... touch point! Price looks to be heading towards the yearly level investors at $6.48
Declinazione di responsabilità
Le informazioni e le pubblicazioni non sono intese come, e non costituiscono, consulenza o raccomandazioni finanziarie, di investimento, di trading o di altro tipo fornite o approvate da TradingView. Per ulteriori informazioni, consultare i Termini di utilizzo.
Declinazione di responsabilità
Le informazioni e le pubblicazioni non sono intese come, e non costituiscono, consulenza o raccomandazioni finanziarie, di investimento, di trading o di altro tipo fornite o approvate da TradingView. Per ulteriori informazioni, consultare i Termini di utilizzo.