
Part 1
Logarythmic chart of marketcap compared with standard chart of BTCUSD
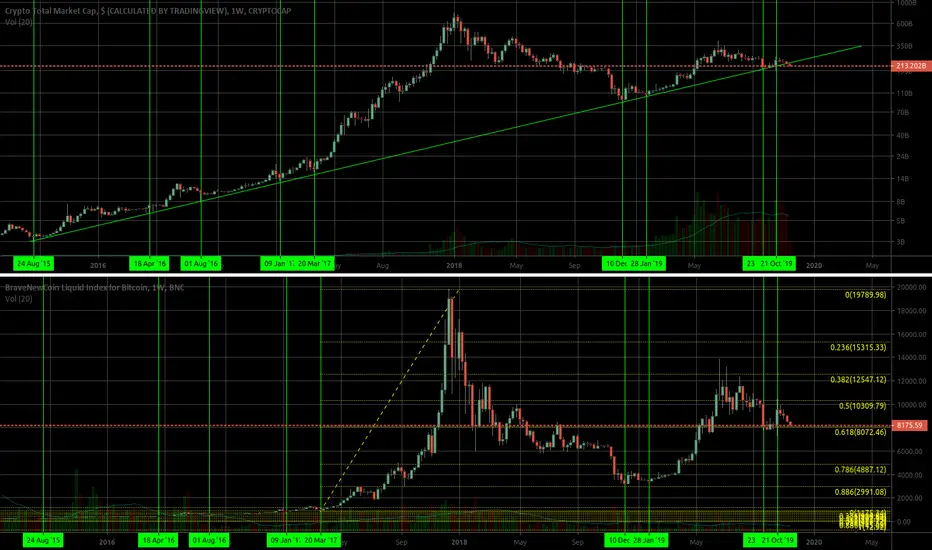
To date, log chart of marketcap has remained above a trendline that was created in 2015. Weekly candles wicked below during the week of Oct 21, 2019; but closed above (first instance of pushing below this since start of trend). Current weekly candle opened below trendline. Every previous instance of testing this trendline has resulted in a major trend change (if following a massive downtrend), or at least an uptick in price (if not first touch after large downtrend). Outcome and significance of opening below trend is TBD once current weekly candle closes.
Logarythmic chart of marketcap compared with standard chart of BTCUSD
To date, log chart of marketcap has remained above a trendline that was created in 2015. Weekly candles wicked below during the week of Oct 21, 2019; but closed above (first instance of pushing below this since start of trend). Current weekly candle opened below trendline. Every previous instance of testing this trendline has resulted in a major trend change (if following a massive downtrend), or at least an uptick in price (if not first touch after large downtrend). Outcome and significance of opening below trend is TBD once current weekly candle closes.

Declinazione di responsabilità
Le informazioni e le pubblicazioni non sono intese come, e non costituiscono, consulenza o raccomandazioni finanziarie, di investimento, di trading o di altro tipo fornite o approvate da TradingView. Per ulteriori informazioni, consultare i Termini di utilizzo.
Declinazione di responsabilità
Le informazioni e le pubblicazioni non sono intese come, e non costituiscono, consulenza o raccomandazioni finanziarie, di investimento, di trading o di altro tipo fornite o approvate da TradingView. Per ulteriori informazioni, consultare i Termini di utilizzo.