
Analysis on the Hourly:
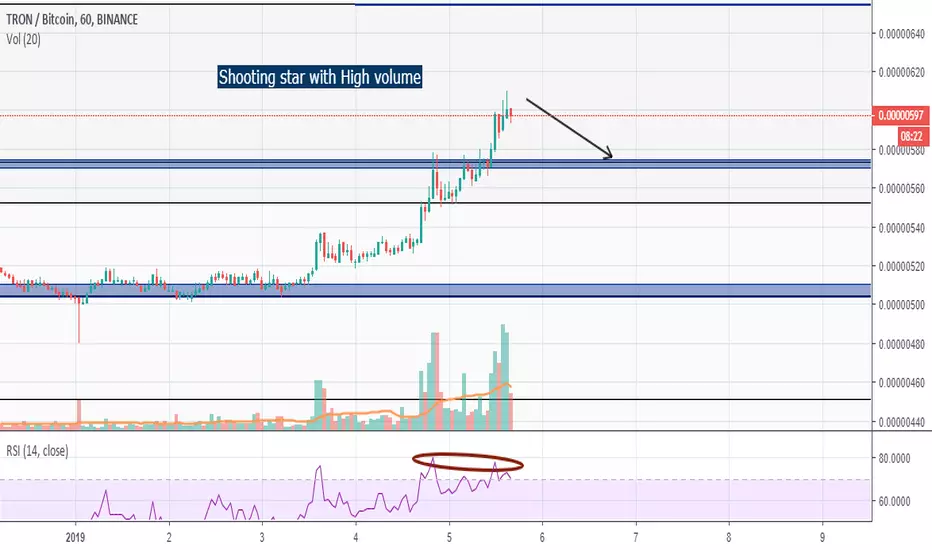
Here we can see a shooting star formed with high volume, this indicates that a lot of selling was done at this point.
If we watch the rsi closely, it formed a double top, which indicates going down.
Now there's two possibilities:
1) Either it keeps going up and touches 652-655 (Fibonacci cluster) ,
2) Or we have a short-term correction to the 570-575.
If 2) occurs, we need to watch that level closely, and find a bullish candle with good volume in order to enter a possible trade to 652-655.
Also, keep in mind that in the 4 hour timeframe, if it forms a hanging man, most likely 2) will occur.
I will keep updating!
If you want to share your ideas , comment down below and like if you enjoyed this analysis.
Here we can see a shooting star formed with high volume, this indicates that a lot of selling was done at this point.
If we watch the rsi closely, it formed a double top, which indicates going down.
Now there's two possibilities:
1) Either it keeps going up and touches 652-655 (Fibonacci cluster) ,
2) Or we have a short-term correction to the 570-575.
If 2) occurs, we need to watch that level closely, and find a bullish candle with good volume in order to enter a possible trade to 652-655.
Also, keep in mind that in the 4 hour timeframe, if it forms a hanging man, most likely 2) will occur.
I will keep updating!
If you want to share your ideas , comment down below and like if you enjoyed this analysis.
Nota
It did the second possibility and rebounded in the fibonacci cluster as predictedTrade chiuso: obiettivo raggiunto
As told in the analysis, it touched our take profit of 652-655.I will post a new chart if anymore trading opportunities occur.

Declinazione di responsabilità
Le informazioni e le pubblicazioni non sono intese come, e non costituiscono, consulenza o raccomandazioni finanziarie, di investimento, di trading o di altro tipo fornite o approvate da TradingView. Per ulteriori informazioni, consultare i Termini di utilizzo.
Declinazione di responsabilità
Le informazioni e le pubblicazioni non sono intese come, e non costituiscono, consulenza o raccomandazioni finanziarie, di investimento, di trading o di altro tipo fornite o approvate da TradingView. Per ulteriori informazioni, consultare i Termini di utilizzo.