
#TRXUSDT
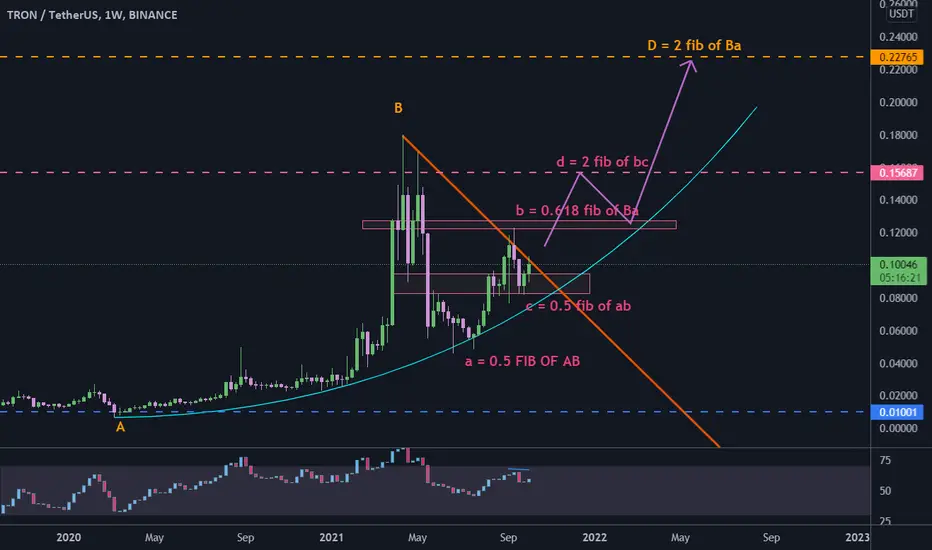
 TRX is trading below a descending resistance line, although price hold above the support zone.
bullish scenario: breaking above the resistance line can lead price upward to touch $0.156 in midterm, and $0.22 in long term as you can see the fib ratios for AB=CD pattern.
bearish scenario: if price break down below support zone, next support is around $0.05 and then $0.01.
TRX is trading below a descending resistance line, although price hold above the support zone.bullish scenario: breaking above the resistance line can lead price upward to touch $0.156 in midterm, and $0.22 in long term as you can see the fib ratios for AB=CD pattern.
bearish scenario: if price break down below support zone, next support is around $0.05 and then $0.01.
Nota
#XTZ/USDT
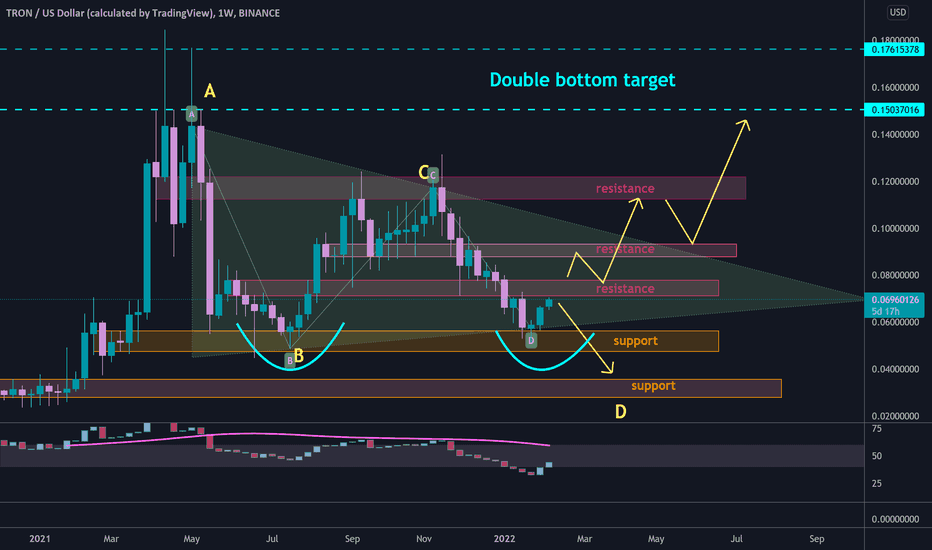
 XTZ rejected from support zone , and reached a resistance zone .
🐮 if price hold the support zone , and break out from resistance zone around $0.077, so it is going up to touch upper line of triangle around resistance zone of $0.09.
🐮🐮 break out from triangle will help price increase more to complete double bottom pattern at $0.15 and $0.176.
🐻 break down from lower line of triangle and support zone , will drop price to complete AB=CD pattern around $0.03

Declinazione di responsabilità
Le informazioni e le pubblicazioni non sono intese come, e non costituiscono, consulenza o raccomandazioni finanziarie, di investimento, di trading o di altro tipo fornite o approvate da TradingView. Per ulteriori informazioni, consultare i Termini di utilizzo.
Declinazione di responsabilità
Le informazioni e le pubblicazioni non sono intese come, e non costituiscono, consulenza o raccomandazioni finanziarie, di investimento, di trading o di altro tipo fornite o approvate da TradingView. Per ulteriori informazioni, consultare i Termini di utilizzo.