
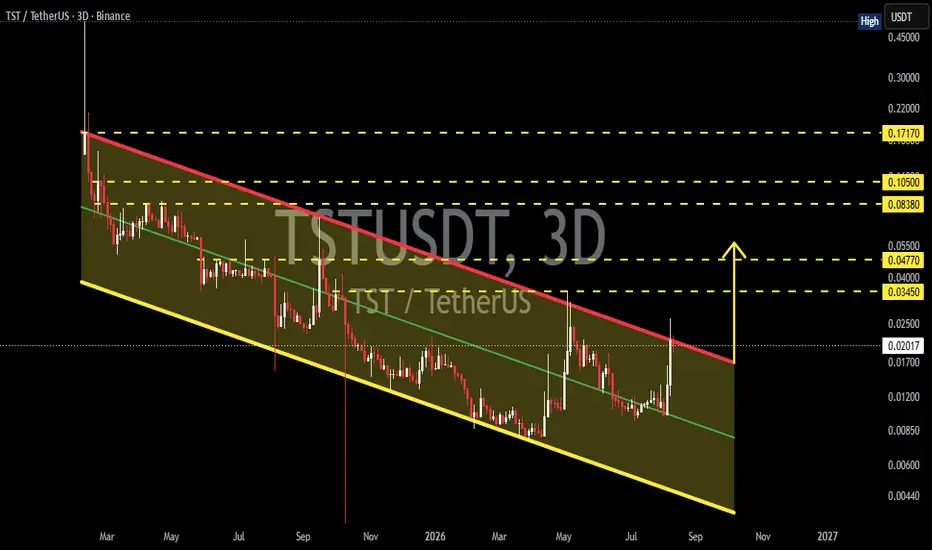
🔎📊 Technical Analysis
💵 Coin: TST #TST
⌛ Time Frame: 3D
📉 Pattern: 🔻 Descending Channel
📍 Current Price: around $0.0203
🎯 Major Resistance: $0.0345 → $0.0477
🚀 Extended Target: $0.0838 → $0.1050 → $0.1717
---
📐🔻 DESCENDING CHANNEL
📊 The chart shows a long-standing 🔻 Descending Channel, with price moving between two major trendlines:
🔴 Upper Descending Trendline — acting as the main dynamic resistance and an extremely important level to watch for confirmation.
🟡 Lower Descending Trendline — acting as the dynamic support / channel floor.
📉 As long as price remains inside the channel, the broader structure continues to indicate a downtrend, characterized by:
🔻 Lower Highs
🔻 Lower Lows
🔻 Rejections at the upper trendline
🔻 Price movement remaining contained within the channel
⚠️ However, there is an important development: price is starting to recover from the lower part of the channel and is moving back toward the upper trendline. 👀🔥
---
🟢🚀 BULLISH SCENARIO
🔥 IfTST manages to break above the upper descending trendline with a strong 3D candle, this pattern could potentially trigger a bullish breakout 🚀📈
✅🔥 Key Confirmation:
🟢 Breakout of the resistance / upper trendline
🕯️ 3D candle close above the trendline
📊 Volume increases during the breakout
🔄 Successful retest, with the trendline turning into support
💪 Buyers maintain price above the breakout area
If the breakout is properly confirmed, the following resistance areas could become potential targets 🎯👇
🎯 $0.0345 — 🟡 First resistance
🎯 $0.0477 — 🟠 Next resistance
🚀 $0.0838 — 🔴 Major resistance
🚀 $0.1050 — 🔥 Higher resistance
💥 $0.1717 — 🚀 Extended target / major historical resistance
⚠️ The $0.0345–$0.0477 zone is particularly important, as this area could attract sellers again. 👀📊
---
🔴📉 BEARISH SCENARIO
⚠️ If price fails to break above the upper descending trendline, another rejection remains highly possible. 📉
🔴 Price gets rejected from resistance
❌ Breakout fails / False Breakout
🕯️ 3D candle closes back below the trendline
📊 Selling volume increases
🐻 Sellers regain control
Under these conditions,TST could continue moving within the Descending Channel structure. 🔻📉
📉 Structural Downside Targets:
➡️ 🟡 Mid-channel / dynamic support
➡️ 🔻 $0.0120 area
➡️ 🔻 $0.0085 area
➡️ ⚠️ If selling pressure becomes very strong, price could retest the lower channel boundary.
🚨 As long as the upper trendline has not been validly broken, the Descending Channel remains technically intact.
---
⚡🔥 KEY AREAS TO WATCH
📍 $0.0203 — 💵 Current price shown on the chart.
🔴 Upper Trendline — 🚧 Main dynamic resistance.
🟢 $0.0345 — 🎯 First major resistance after a breakout.
🟢 $0.0477 — 🎯 Next key resistance / target.
🚀 $0.0838 — 🔥 Major resistance.
🚀 $0.1050 — 💥 Higher resistance.
🔥 $0.1717 — 🚀 Long-term extended target.
---
🧠📌 CONCLUSION
TST is currently at a very important phase within the Descending Channel. 👀📊
📉 Structurally, the trend remains bearish as long as price stays below the upper descending trendline.
However, the recovery from the lower part of the channel makes a breakout scenario very important to watch. 🔥🚀
🟢🚀 BULLISH CONFIRMATION:
💥 Breakout + 3D Close + Volume Confirmation
⬇️
🔄 Successful Retest
⬇️
🎯 $0.0345 → $0.0477
⬇️
🚀 $0.0838 → $0.1050
⬇️
🔥 $0.1717
🔴🐻 BEARISH CONFIRMATION:
❌ Rejection from the upper trendline
⬇️
📉 False breakout / breakdown
⬇️
🔻 Price returns inside the channel
⬇️
🎯 $0.0120 → $0.0085
⬇️
⚠️ Potential retest of the lower channel
---
🎯🔥 KEY LEVELS
🟢 $0.0345
➡️ First Major Resistance
🟢 $0.0477
➡️ Key Resistance / Breakout Target
🚀 $0.0838
➡️ Major Resistance
🔥 $0.1050
➡️ Higher Resistance
💥 $0.1717
➡️ Extended Long-Term Target
---
👀🔥 WATCH THE BREAKOUT!
📈 The upper channel resistance is the KEY.
🟢 Valid breakout = potential trend reversal / expansion move 🚀
🔴 Rejection = Descending Channel remains active 📉
⚠️ Confirmation is more important than anticipation.
---
#TST #TSTUSDT #Crypto #CryptoAnalysis #TechnicalAnalysis #CryptoTrading #Altcoins #AltcoinAnalysis #DescendingChannel #Breakout #BullishBreakout #Bearish #CryptoMarket #PriceAction #CryptoSignals #TradingSetup #MarketAnalysis
💵 Coin:
TST #TST⌛ Time Frame: 3D
📉 Pattern: 🔻 Descending Channel
📍 Current Price: around $0.0203
🎯 Major Resistance: $0.0345 → $0.0477
🚀 Extended Target: $0.0838 → $0.1050 → $0.1717
---
📐🔻 DESCENDING CHANNEL
📊 The chart shows a long-standing 🔻 Descending Channel, with price moving between two major trendlines:
🔴 Upper Descending Trendline — acting as the main dynamic resistance and an extremely important level to watch for confirmation.
🟡 Lower Descending Trendline — acting as the dynamic support / channel floor.
📉 As long as price remains inside the channel, the broader structure continues to indicate a downtrend, characterized by:
🔻 Lower Highs
🔻 Lower Lows
🔻 Rejections at the upper trendline
🔻 Price movement remaining contained within the channel
⚠️ However, there is an important development: price is starting to recover from the lower part of the channel and is moving back toward the upper trendline. 👀🔥
---
🟢🚀 BULLISH SCENARIO
🔥 If
TST manages to break above the upper descending trendline with a strong 3D candle, this pattern could potentially trigger a bullish breakout 🚀📈✅🔥 Key Confirmation:
🟢 Breakout of the resistance / upper trendline
🕯️ 3D candle close above the trendline
📊 Volume increases during the breakout
🔄 Successful retest, with the trendline turning into support
💪 Buyers maintain price above the breakout area
If the breakout is properly confirmed, the following resistance areas could become potential targets 🎯👇
🎯 $0.0345 — 🟡 First resistance
🎯 $0.0477 — 🟠 Next resistance
🚀 $0.0838 — 🔴 Major resistance
🚀 $0.1050 — 🔥 Higher resistance
💥 $0.1717 — 🚀 Extended target / major historical resistance
⚠️ The $0.0345–$0.0477 zone is particularly important, as this area could attract sellers again. 👀📊
---
🔴📉 BEARISH SCENARIO
⚠️ If price fails to break above the upper descending trendline, another rejection remains highly possible. 📉
🔴 Price gets rejected from resistance
❌ Breakout fails / False Breakout
🕯️ 3D candle closes back below the trendline
📊 Selling volume increases
🐻 Sellers regain control
Under these conditions,
TST could continue moving within the Descending Channel structure. 🔻📉📉 Structural Downside Targets:
➡️ 🟡 Mid-channel / dynamic support
➡️ 🔻 $0.0120 area
➡️ 🔻 $0.0085 area
➡️ ⚠️ If selling pressure becomes very strong, price could retest the lower channel boundary.
🚨 As long as the upper trendline has not been validly broken, the Descending Channel remains technically intact.
---
⚡🔥 KEY AREAS TO WATCH
📍 $0.0203 — 💵 Current price shown on the chart.
🔴 Upper Trendline — 🚧 Main dynamic resistance.
🟢 $0.0345 — 🎯 First major resistance after a breakout.
🟢 $0.0477 — 🎯 Next key resistance / target.
🚀 $0.0838 — 🔥 Major resistance.
🚀 $0.1050 — 💥 Higher resistance.
🔥 $0.1717 — 🚀 Long-term extended target.
---
🧠📌 CONCLUSION
TST is currently at a very important phase within the Descending Channel. 👀📊📉 Structurally, the trend remains bearish as long as price stays below the upper descending trendline.
However, the recovery from the lower part of the channel makes a breakout scenario very important to watch. 🔥🚀
🟢🚀 BULLISH CONFIRMATION:
💥 Breakout + 3D Close + Volume Confirmation
⬇️
🔄 Successful Retest
⬇️
🎯 $0.0345 → $0.0477
⬇️
🚀 $0.0838 → $0.1050
⬇️
🔥 $0.1717
🔴🐻 BEARISH CONFIRMATION:
❌ Rejection from the upper trendline
⬇️
📉 False breakout / breakdown
⬇️
🔻 Price returns inside the channel
⬇️
🎯 $0.0120 → $0.0085
⬇️
⚠️ Potential retest of the lower channel
---
🎯🔥 KEY LEVELS
🟢 $0.0345
➡️ First Major Resistance
🟢 $0.0477
➡️ Key Resistance / Breakout Target
🚀 $0.0838
➡️ Major Resistance
🔥 $0.1050
➡️ Higher Resistance
💥 $0.1717
➡️ Extended Long-Term Target
---
👀🔥 WATCH THE BREAKOUT!
📈 The upper channel resistance is the KEY.
🟢 Valid breakout = potential trend reversal / expansion move 🚀
🔴 Rejection = Descending Channel remains active 📉
⚠️ Confirmation is more important than anticipation.
---
#TST #TSTUSDT #Crypto #CryptoAnalysis #TechnicalAnalysis #CryptoTrading #Altcoins #AltcoinAnalysis #DescendingChannel #Breakout #BullishBreakout #Bearish #CryptoMarket #PriceAction #CryptoSignals #TradingSetup #MarketAnalysis

✅ Get Free Signals! Join Our Telegram Channel Here: t.me/TheCryptoNuclear
✅ Twitter: twitter.com/crypto_nuclear
✅ Join Bybit : partner.bybit.com/b/nuclearvip
✅ Benefits : Lifetime Trading Fee Discount -50%
✅ Twitter: twitter.com/crypto_nuclear
✅ Join Bybit : partner.bybit.com/b/nuclearvip
✅ Benefits : Lifetime Trading Fee Discount -50%
Declinazione di responsabilità
Le informazioni e le pubblicazioni non sono intese come, e non costituiscono, consulenza o raccomandazioni finanziarie, di investimento, di trading o di altro tipo fornite o approvate da TradingView. Per ulteriori informazioni, consultare i Termini di utilizzo.