
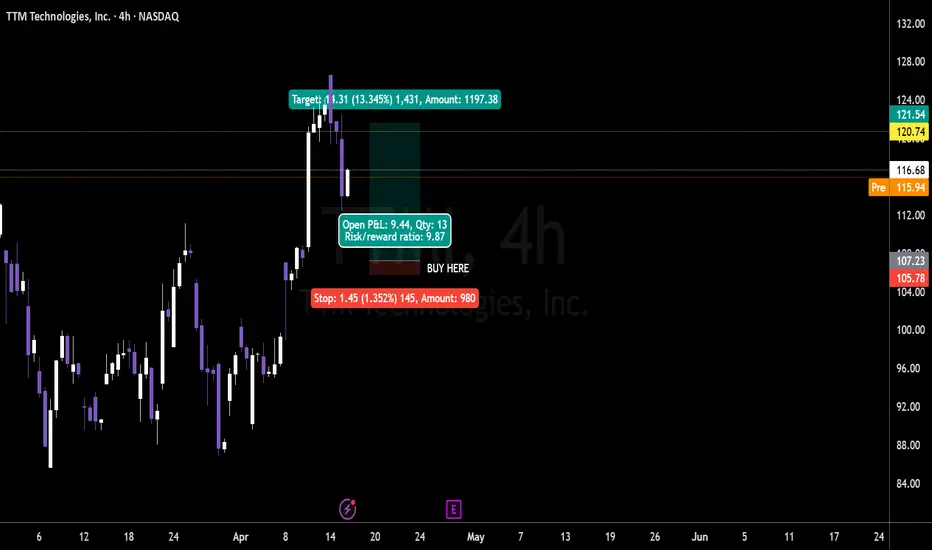
TTM Technologies is showing a clean higher-timeframe setup after a strong move, with price pulling back into a defined weekly demand area near the 4h structure on your chart.
The business backdrop is constructive as well: FY2025 net sales came in at $2.906 billion, non-GAAP EPS reached $2.46, and Q4 2025 revenue was $774.3 million with A&D backlog at $1.61 billion.
The stock is currently trading around the $116 area on your chart, after tagging the recent highs and then retracing into a technically important zone. TTM’s FY2025 results also showed improving profitability and leverage, with non-GAAP operating margin at 11.7% and net debt/EBITDA down to 0.9x, which supports the case for institutional accumulation on weakness.
Analyst sentiment is supportive, with Public showing a Strong Buy consensus as of mid-April 2026, and the company has a Q1 2026 conference call scheduled for April 29, 2026.
🟢 Buy Zone 1 ($107.23 area)
Top of the blue demand shelf on your chart and the first area where buyers have already defended price.
Stop: $105.78
Position risk: $980
Qty: 13
Risk/Reward Ratio: 9.87
Target: $121.54
🟢 Buy Zone 2 ($96.00 area)
Deeper weekly support and a cleaner value area if the first zone fails.
Stop: $92.00
Position risk: $980
Qty: 13
Risk/Reward Ratio: 13+
Target: $124.00
Key Levels:
🔑 Current Price: $116.60
🔑 Buy Zone 1: $107.23 | Stop: $105.78
🔑 Buy Zone 2: $96.00 | Stop: $92.00
🔑 Recent High: $121.54
🔑 FY2025 Revenue: $2.906B
🔑 FY2025 Non-GAAP EPS: $2.46
🔑 FY2025 Net Debt/EBITDA: 0.9x
🔑 FY2025 A&D Backlog: $1.61B
🔑 Strong Buy Consensus: 100% on Public
🎯 Target 1: $121.54
🎯 Target 2: $124.00
TTM is not a story stock, it is a cash-generative industrial technology name with improving margins, lower leverage, and a strong defense/data-center mix. The setup is simple: if the weekly demand holds, the pullback looks like a normal continuation entry rather than a trend break.
The business backdrop is constructive as well: FY2025 net sales came in at $2.906 billion, non-GAAP EPS reached $2.46, and Q4 2025 revenue was $774.3 million with A&D backlog at $1.61 billion.
The stock is currently trading around the $116 area on your chart, after tagging the recent highs and then retracing into a technically important zone. TTM’s FY2025 results also showed improving profitability and leverage, with non-GAAP operating margin at 11.7% and net debt/EBITDA down to 0.9x, which supports the case for institutional accumulation on weakness.
Analyst sentiment is supportive, with Public showing a Strong Buy consensus as of mid-April 2026, and the company has a Q1 2026 conference call scheduled for April 29, 2026.
🟢 Buy Zone 1 ($107.23 area)
Top of the blue demand shelf on your chart and the first area where buyers have already defended price.
Stop: $105.78
Position risk: $980
Qty: 13
Risk/Reward Ratio: 9.87
Target: $121.54
🟢 Buy Zone 2 ($96.00 area)
Deeper weekly support and a cleaner value area if the first zone fails.
Stop: $92.00
Position risk: $980
Qty: 13
Risk/Reward Ratio: 13+
Target: $124.00
Key Levels:
🔑 Current Price: $116.60
🔑 Buy Zone 1: $107.23 | Stop: $105.78
🔑 Buy Zone 2: $96.00 | Stop: $92.00
🔑 Recent High: $121.54
🔑 FY2025 Revenue: $2.906B
🔑 FY2025 Non-GAAP EPS: $2.46
🔑 FY2025 Net Debt/EBITDA: 0.9x
🔑 FY2025 A&D Backlog: $1.61B
🔑 Strong Buy Consensus: 100% on Public
🎯 Target 1: $121.54
🎯 Target 2: $124.00
TTM is not a story stock, it is a cash-generative industrial technology name with improving margins, lower leverage, and a strong defense/data-center mix. The setup is simple: if the weekly demand holds, the pullback looks like a normal continuation entry rather than a trend break.

Declinazione di responsabilità
Le informazioni e le pubblicazioni non sono intese come, e non costituiscono, consulenza o raccomandazioni finanziarie, di investimento, di trading o di altro tipo fornite o approvate da TradingView. Per ulteriori informazioni, consultare i Termini di utilizzo.
Declinazione di responsabilità
Le informazioni e le pubblicazioni non sono intese come, e non costituiscono, consulenza o raccomandazioni finanziarie, di investimento, di trading o di altro tipo fornite o approvate da TradingView. Per ulteriori informazioni, consultare i Termini di utilizzo.