
UBCP: A Fibonacci Map Can Organize a Decline Without Calling a Bottom
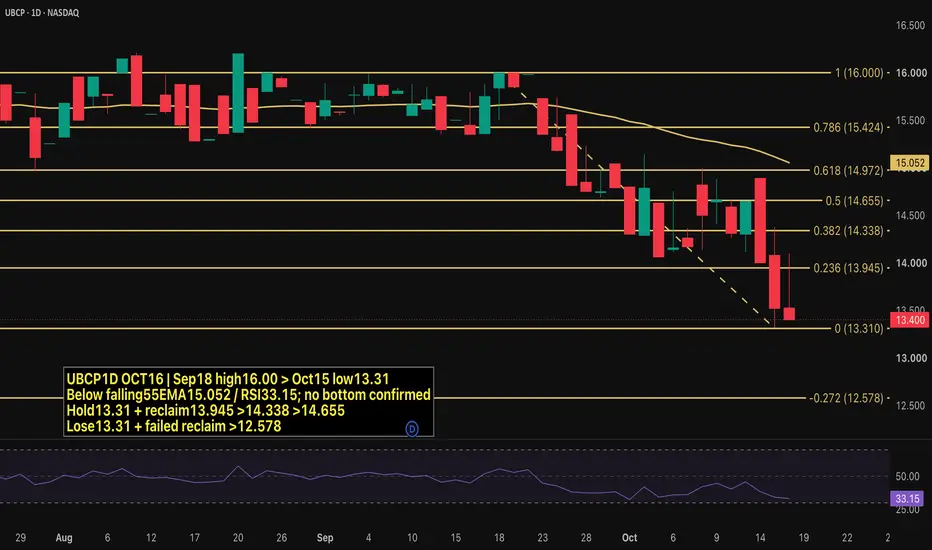
The UBCP daily chart through October 16 offers a useful lesson in separating a measurement from a reversal claim. The selected recent downswing starts at the September 18 high of 16.00 and ends at the October 15 low of 13.31. That is a 2.69-point decline. These endpoints organize the recent move; they do not assert that the entire longer history begins at that high or that the lower endpoint must remain the final low.
October 16 opened at 13.53, reached 14.10, traded down to 13.40 and closed at 13.40. The candle therefore finished at its own low, beneath the dated 55 EMA at 15.052. RSI 14 was 33.15. The recent average slopes downward, while the displayed sequence shows price losing earlier reaction areas. A relatively low oscillator reading does not independently establish that the decline has ended.
Measured upward from 13.31, the 23.6% retracement is 13.945, the 38.2% reference is 14.338 and the halfway convention is 14.655. The 61.8% reference is 14.972 and the 78.6% level is 15.424. Halfway is not a Fibonacci ratio. Each number follows the same equation: low plus the selected fraction of the 2.69-point range. Changing the anchors changes the map, which is why the source candles are identified on the image.
Notice the difference between trading through a level and accepting above it. October 16's high of 14.10 exceeded the first retracement, but its close at 13.40 was below that reference. That daily observation does not describe a completed held recovery. A future first crossing would still need a separate return test; the level itself cannot supply the follow-through.
A constructive conditional route first preserves the 13.31 low, then regains 13.945 and holds a distinct return above it. That would bring 14.338 into review before the 14.655 midpoint. The dated average near 15.052 sits beyond those nearer hurdles, close to but numerically separate from the 14.972 retracement. A return to the average would therefore not be the first step in the repair sequence.
The failure route is sustained loss of 13.31 followed by an unsuccessful reclaim. The selected downside 27.2% extension is approximately 12.578. It is calculated as 13.31 minus 0.272 times 2.69, not an observed new low or promised destination. A quick recovery of the lost shelf would challenge the breakdown interpretation. Acceptance above 16.00 would challenge the selected downswing ceiling instead.
For a regional bank, changes in rates can affect several operating channels, including funding and asset yields, but this chart alone does not calculate those earnings effects. No new issuer catalyst or company-specific profit explanation is asserted. The lesson is technical: a ladder can organize decision points while the prevailing trend remains weak.
Gaps, spreads and thin liquidity can move an execution beyond a planned invalidation. This historical daily teaching example through October 16 is not a claim about a completed Monday candle, an actual position or a guaranteed reversal.
Discussion: would you treat a brief move above 13.945 as repair, or wait for a separate return that holds before reviewing the next retracement?
The UBCP daily chart through October 16 offers a useful lesson in separating a measurement from a reversal claim. The selected recent downswing starts at the September 18 high of 16.00 and ends at the October 15 low of 13.31. That is a 2.69-point decline. These endpoints organize the recent move; they do not assert that the entire longer history begins at that high or that the lower endpoint must remain the final low.
October 16 opened at 13.53, reached 14.10, traded down to 13.40 and closed at 13.40. The candle therefore finished at its own low, beneath the dated 55 EMA at 15.052. RSI 14 was 33.15. The recent average slopes downward, while the displayed sequence shows price losing earlier reaction areas. A relatively low oscillator reading does not independently establish that the decline has ended.
Measured upward from 13.31, the 23.6% retracement is 13.945, the 38.2% reference is 14.338 and the halfway convention is 14.655. The 61.8% reference is 14.972 and the 78.6% level is 15.424. Halfway is not a Fibonacci ratio. Each number follows the same equation: low plus the selected fraction of the 2.69-point range. Changing the anchors changes the map, which is why the source candles are identified on the image.
Notice the difference between trading through a level and accepting above it. October 16's high of 14.10 exceeded the first retracement, but its close at 13.40 was below that reference. That daily observation does not describe a completed held recovery. A future first crossing would still need a separate return test; the level itself cannot supply the follow-through.
A constructive conditional route first preserves the 13.31 low, then regains 13.945 and holds a distinct return above it. That would bring 14.338 into review before the 14.655 midpoint. The dated average near 15.052 sits beyond those nearer hurdles, close to but numerically separate from the 14.972 retracement. A return to the average would therefore not be the first step in the repair sequence.
The failure route is sustained loss of 13.31 followed by an unsuccessful reclaim. The selected downside 27.2% extension is approximately 12.578. It is calculated as 13.31 minus 0.272 times 2.69, not an observed new low or promised destination. A quick recovery of the lost shelf would challenge the breakdown interpretation. Acceptance above 16.00 would challenge the selected downswing ceiling instead.
For a regional bank, changes in rates can affect several operating channels, including funding and asset yields, but this chart alone does not calculate those earnings effects. No new issuer catalyst or company-specific profit explanation is asserted. The lesson is technical: a ladder can organize decision points while the prevailing trend remains weak.
Gaps, spreads and thin liquidity can move an execution beyond a planned invalidation. This historical daily teaching example through October 16 is not a claim about a completed Monday candle, an actual position or a guaranteed reversal.
Discussion: would you treat a brief move above 13.945 as repair, or wait for a separate return that holds before reviewing the next retracement?

Hollow Point Trading | Options, futures & price-action education. Study chart lessons, risk management and market research: hollowpointtrading.com/academy | Education only. Trading involves risk.
Declinazione di responsabilità
Le informazioni e le pubblicazioni non sono intese come, e non costituiscono, consulenza o raccomandazioni finanziarie, di investimento, di trading o di altro tipo fornite o approvate da TradingView. Per ulteriori informazioni, consultare i Termini di utilizzo.
Hollow Point Trading | Options, futures & price-action education. Study chart lessons, risk management and market research: hollowpointtrading.com/academy | Education only. Trading involves risk.
Declinazione di responsabilità
Le informazioni e le pubblicazioni non sono intese come, e non costituiscono, consulenza o raccomandazioni finanziarie, di investimento, di trading o di altro tipo fornite o approvate da TradingView. Per ulteriori informazioni, consultare i Termini di utilizzo.