
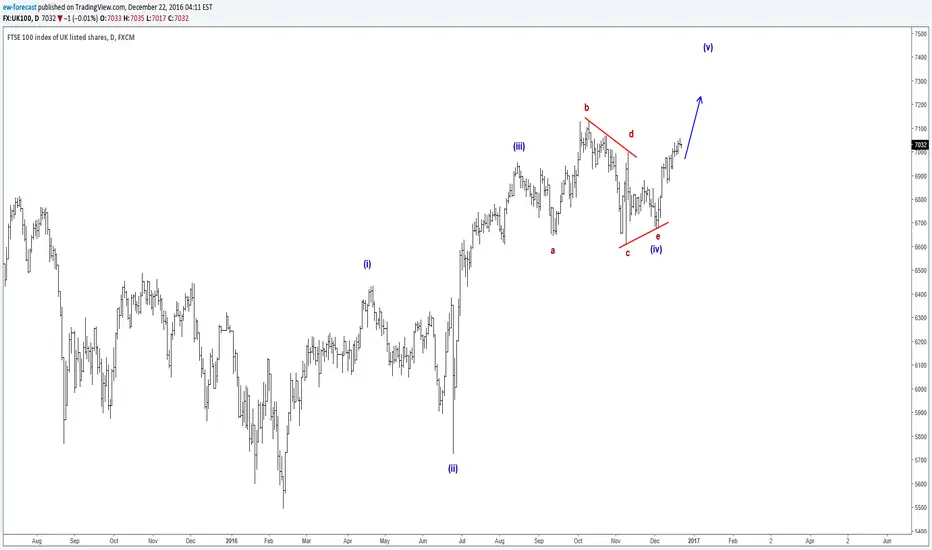
On the Daily chart of UK100 index we are looking at a higher degree impulse taking place with price specifically trading in final wave (v) of a five wave move.
As we can see market activity displayed a five wave pattern in the previous fourth wave correction, that is also known as an Elliott Wave triangle. This is a continuation pattern that occurs prior to the final wave within higher cycle. That said we need to see a decisive break above the wave d swing of the triangle for a confirmation that correction is really over and that more upside may follow.
As we can see market activity displayed a five wave pattern in the previous fourth wave correction, that is also known as an Elliott Wave triangle. This is a continuation pattern that occurs prior to the final wave within higher cycle. That said we need to see a decisive break above the wave d swing of the triangle for a confirmation that correction is really over and that more upside may follow.

Join the community for one week, full access. Its free >> @ wavetraders.com/elliott-wave-plans/
Learn Elliott Waves Sale-65%
👉 wavetraders.com/academy/
Newsletter
👉 bit.ly/3FVPVzO
Learn Elliott Waves Sale-65%
👉 wavetraders.com/academy/
Newsletter
👉 bit.ly/3FVPVzO
Declinazione di responsabilità
Le informazioni e le pubblicazioni non sono intese come, e non costituiscono, consulenza o raccomandazioni finanziarie, di investimento, di trading o di altro tipo fornite o approvate da TradingView. Per ulteriori informazioni, consultare i Termini di utilizzo.
Join the community for one week, full access. Its free >> @ wavetraders.com/elliott-wave-plans/
Learn Elliott Waves Sale-65%
👉 wavetraders.com/academy/
Newsletter
👉 bit.ly/3FVPVzO
Learn Elliott Waves Sale-65%
👉 wavetraders.com/academy/
Newsletter
👉 bit.ly/3FVPVzO
Declinazione di responsabilità
Le informazioni e le pubblicazioni non sono intese come, e non costituiscono, consulenza o raccomandazioni finanziarie, di investimento, di trading o di altro tipo fornite o approvate da TradingView. Per ulteriori informazioni, consultare i Termini di utilizzo.