
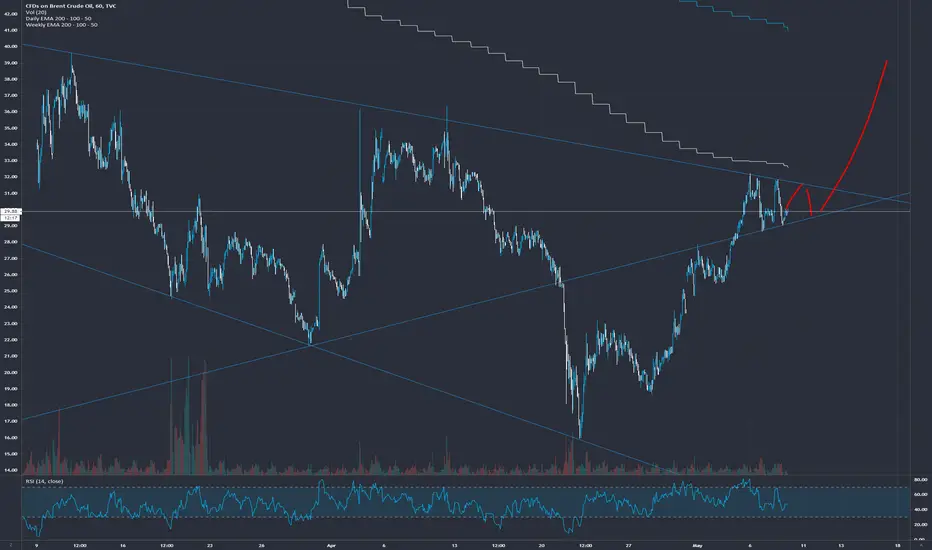
In my last post I stated my bearishness because the - seemingly - rejection of >30 levels. Right after the post, a bull run started and we went from low 29 levels to 31.75. A very strong correction indicating market still believes in upside.
The momentum stopped exactly at the trendline forming the broadening falling wedge. When reversing, heading down again, Brent found support on a trendline indicated in the graph, forming a higher lower. This trendline, together with the resistance of the falling wedge, forms a symmetrical triangle, a nice range bound area, which in my opinion should break out on the upside, given the entry into the triangle from below.
It is a very sudden change of my view on Brent, but itsn't that what trading is all about? Acknowledging you might be wrong and being flexible in position taking, and not being stuck to your believe?
The momentum stopped exactly at the trendline forming the broadening falling wedge. When reversing, heading down again, Brent found support on a trendline indicated in the graph, forming a higher lower. This trendline, together with the resistance of the falling wedge, forms a symmetrical triangle, a nice range bound area, which in my opinion should break out on the upside, given the entry into the triangle from below.
It is a very sudden change of my view on Brent, but itsn't that what trading is all about? Acknowledging you might be wrong and being flexible in position taking, and not being stuck to your believe?

Pubblicazioni correlate
Declinazione di responsabilità
Le informazioni e le pubblicazioni non sono intese come, e non costituiscono, consulenza o raccomandazioni finanziarie, di investimento, di trading o di altro tipo fornite o approvate da TradingView. Per ulteriori informazioni, consultare i Termini di utilizzo.
Pubblicazioni correlate
Declinazione di responsabilità
Le informazioni e le pubblicazioni non sono intese come, e non costituiscono, consulenza o raccomandazioni finanziarie, di investimento, di trading o di altro tipo fornite o approvate da TradingView. Per ulteriori informazioni, consultare i Termini di utilizzo.