
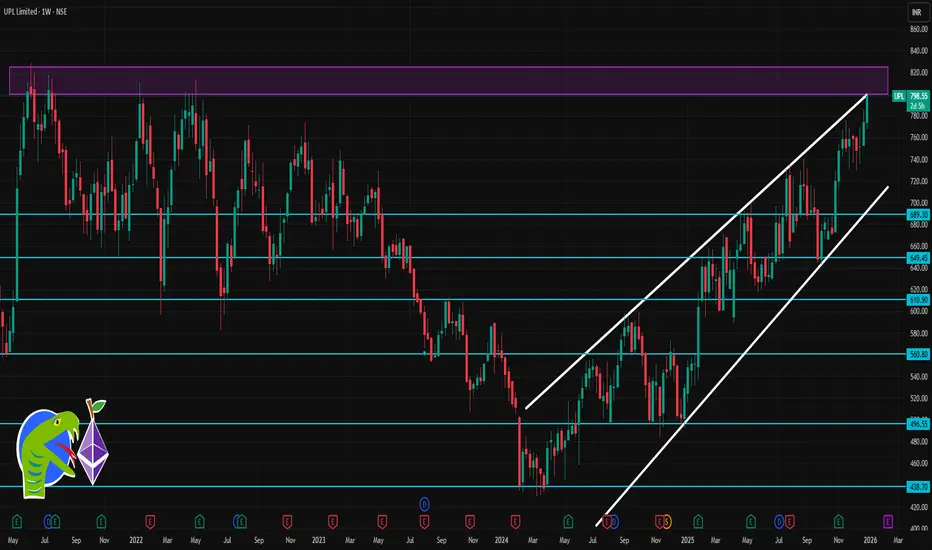
📌 Current Price Snapshot
Approx Current Price (NSE): ₹770–₹780 range (varies slightly by source and time) — ~₹774 area recently quoted.
52‑week High: ~₹786.30
52‑week High: ~₹786.30
📊 Weekly Support & Resistance (Accurate Levels)
🔥 Key Weekly Pivot (Bias Level)
Weekly Pivot: ~₹770.8–₹773.8 — central reference zone for weekly trend.
Above = bullish bias
Below = bearish/weak bias
🟢 Support Levels (Weekly Frame)
1️⃣ Immediate Support: ~₹769–₹770
2️⃣ Next Support: ~₹764–₹765
3️⃣ Lower Support: ~₹758–₹760
4️⃣ Stronger Lower Zone: ~₹736–₹721 (secondary structurals)
🔴 Resistance Levels (Weekly Frame)
1️⃣ Immediate Resistance: ~₹779–₹780
2️⃣ Next Zone: ~₹785–₹790
3️⃣ Higher Weekly Resistances: ~₹805–₹824+ (if breakout happens)
🧩 Summary Table — Weekly Levels
Level Category Approx Level (₹)
Weekly Pivot 770–774
Support 1 769–770
Support 2 764–765
Support 3 758–760
Resistance 1 779–780
Resistance 2 785–790
Higher Resistance ~805–~824
Note: These reflect technical pivot & Fibonacci zones on the weekly frame.
📌 How to Use These Levels
✅ Above Pivot (~771–774) → Weekly bias tends bullish.
✅ Sustain above ~780–785 → Breakout zone — next leg could aim towards ~800+.
✅ Break below ~764 → Weakness may extend toward lower supports.
Approx Current Price (NSE): ₹770–₹780 range (varies slightly by source and time) — ~₹774 area recently quoted.
52‑week High: ~₹786.30
52‑week High: ~₹786.30
📊 Weekly Support & Resistance (Accurate Levels)
🔥 Key Weekly Pivot (Bias Level)
Weekly Pivot: ~₹770.8–₹773.8 — central reference zone for weekly trend.
Above = bullish bias
Below = bearish/weak bias
🟢 Support Levels (Weekly Frame)
1️⃣ Immediate Support: ~₹769–₹770
2️⃣ Next Support: ~₹764–₹765
3️⃣ Lower Support: ~₹758–₹760
4️⃣ Stronger Lower Zone: ~₹736–₹721 (secondary structurals)
🔴 Resistance Levels (Weekly Frame)
1️⃣ Immediate Resistance: ~₹779–₹780
2️⃣ Next Zone: ~₹785–₹790
3️⃣ Higher Weekly Resistances: ~₹805–₹824+ (if breakout happens)
🧩 Summary Table — Weekly Levels
Level Category Approx Level (₹)
Weekly Pivot 770–774
Support 1 769–770
Support 2 764–765
Support 3 758–760
Resistance 1 779–780
Resistance 2 785–790
Higher Resistance ~805–~824
Note: These reflect technical pivot & Fibonacci zones on the weekly frame.
📌 How to Use These Levels
✅ Above Pivot (~771–774) → Weekly bias tends bullish.
✅ Sustain above ~780–785 → Breakout zone — next leg could aim towards ~800+.
✅ Break below ~764 → Weakness may extend toward lower supports.

Contact Knowledgehub for a detailed consultation: Dm on WhatsApp: [wa.link/a2o0kz]-
Phone No: [+91 93102 26243]-
Email: [tradingviewknowledgehub@gmail.com]---
-- Let’s achieve success together!
Phone No: [+91 93102 26243]-
Email: [tradingviewknowledgehub@gmail.com]---
-- Let’s achieve success together!
Pubblicazioni correlate
Declinazione di responsabilità
Le informazioni e le pubblicazioni non sono intese come, e non costituiscono, consulenza o raccomandazioni finanziarie, di investimento, di trading o di altro tipo fornite o approvate da TradingView. Per ulteriori informazioni, consultare i Termini di utilizzo.
Contact Knowledgehub for a detailed consultation: Dm on WhatsApp: [wa.link/a2o0kz]-
Phone No: [+91 93102 26243]-
Email: [tradingviewknowledgehub@gmail.com]---
-- Let’s achieve success together!
Phone No: [+91 93102 26243]-
Email: [tradingviewknowledgehub@gmail.com]---
-- Let’s achieve success together!
Pubblicazioni correlate
Declinazione di responsabilità
Le informazioni e le pubblicazioni non sono intese come, e non costituiscono, consulenza o raccomandazioni finanziarie, di investimento, di trading o di altro tipo fornite o approvate da TradingView. Per ulteriori informazioni, consultare i Termini di utilizzo.