
So much for the government shutdown. US equity indices have rallied again today, thanks to ongoing bullish momentum and AI optimism. Bets that the Fed easing will continue to support corporate earnings are keeping the bulls fully in charge with traders continuing to take the ongoing US gov shutdown in their stride..
While tech stocks continue to shine -- led by Advanced Micro Devices (AMD), which soared after signing a deal with OpenAI to roll out AI infrastructure -- small caps are doing great too ahead of the earnings season.
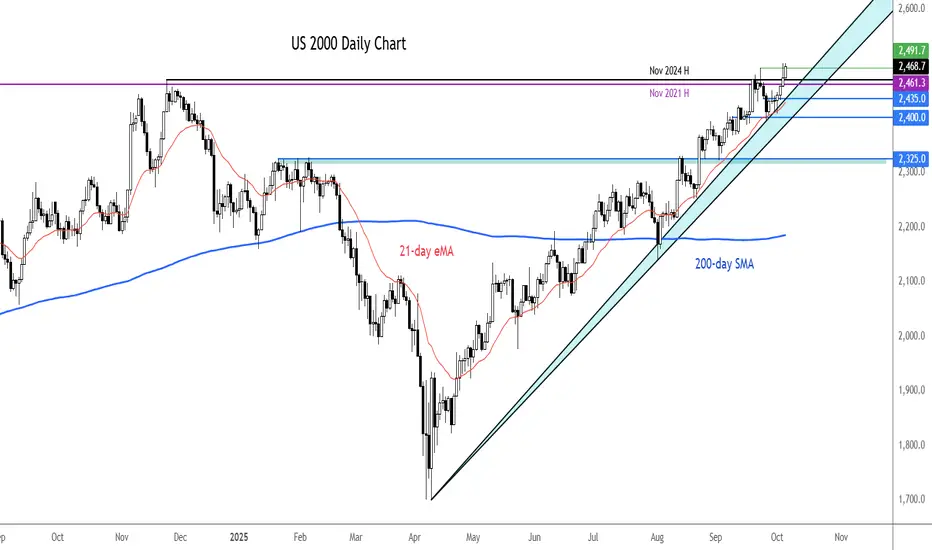
The Russell has been printing lots of bullish price action lately and we have called for new highs on the index. It has not let us down and today climbed to a new high, after taking out a long-term resistance zone between 2461 and 2468, marking the highs from 2021 and 2024.
The breakout means the index has also poked its head above last week's high at 2491, thus invalidating the bearish-looking inverted hammer candle that had pointed to a potential top. Well that candle only preceded a modest pullback, as the index has now hit a new record. 2500, 2600 could be the next upside targets from. Key support levels below that 2461-2468 range are marked on the chart.
By Fawad Razaqzada, market analyst with FOREX.com
While tech stocks continue to shine -- led by Advanced Micro Devices (AMD), which soared after signing a deal with OpenAI to roll out AI infrastructure -- small caps are doing great too ahead of the earnings season.
The Russell has been printing lots of bullish price action lately and we have called for new highs on the index. It has not let us down and today climbed to a new high, after taking out a long-term resistance zone between 2461 and 2468, marking the highs from 2021 and 2024.
The breakout means the index has also poked its head above last week's high at 2491, thus invalidating the bearish-looking inverted hammer candle that had pointed to a potential top. Well that candle only preceded a modest pullback, as the index has now hit a new record. 2500, 2600 could be the next upside targets from. Key support levels below that 2461-2468 range are marked on the chart.
By Fawad Razaqzada, market analyst with FOREX.com

Pubblicazioni correlate
Declinazione di responsabilità
Le informazioni e le pubblicazioni non sono intese come, e non costituiscono, consulenza o raccomandazioni finanziarie, di investimento, di trading o di altro tipo fornite o approvate da TradingView. Per ulteriori informazioni, consultare i Termini di utilizzo.
Pubblicazioni correlate
Declinazione di responsabilità
Le informazioni e le pubblicazioni non sono intese come, e non costituiscono, consulenza o raccomandazioni finanziarie, di investimento, di trading o di altro tipo fornite o approvate da TradingView. Per ulteriori informazioni, consultare i Termini di utilizzo.