

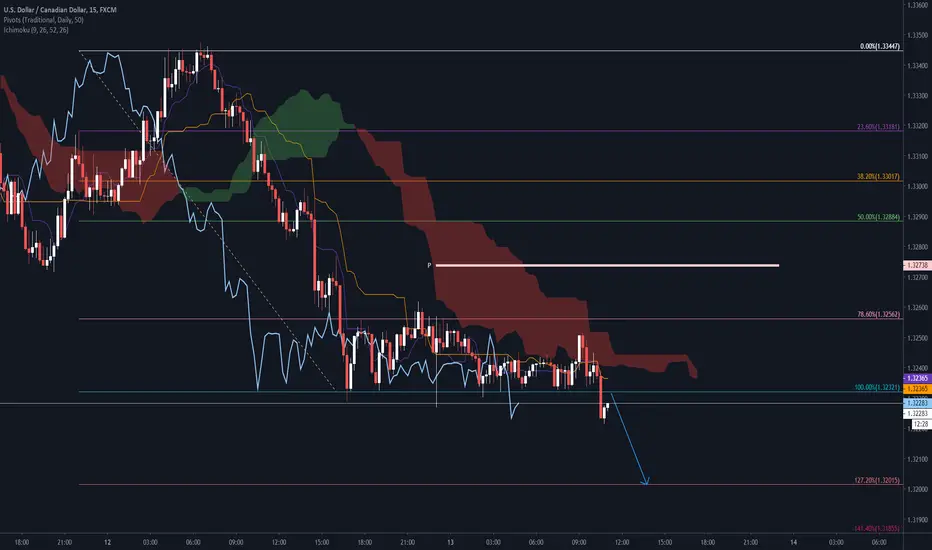
Price is well below the daily pivot level.
The Lagging Span (LS), in blue on my chart, just broke the price to the downside which is the bottom of the current structure (support for the last 19 hours) indicating an imminent sell-off.
I am selling now @ market price and will target the next fib level (reversed) as shown in my chart.
Trade at your own risk
The Lagging Span (LS), in blue on my chart, just broke the price to the downside which is the bottom of the current structure (support for the last 19 hours) indicating an imminent sell-off.
I am selling now @ market price and will target the next fib level (reversed) as shown in my chart.
Trade at your own risk
Nota
Added to my shorts, expecting the downtrend to continue at least on the next H4 candleTrade chiuso: obiettivo raggiunto

Pubblicazioni correlate
Declinazione di responsabilità
Le informazioni e le pubblicazioni non sono intese come, e non costituiscono, consulenza o raccomandazioni finanziarie, di investimento, di trading o di altro tipo fornite o approvate da TradingView. Per ulteriori informazioni, consultare i Termini di utilizzo.
Pubblicazioni correlate
Declinazione di responsabilità
Le informazioni e le pubblicazioni non sono intese come, e non costituiscono, consulenza o raccomandazioni finanziarie, di investimento, di trading o di altro tipo fornite o approvate da TradingView. Per ulteriori informazioni, consultare i Termini di utilizzo.