

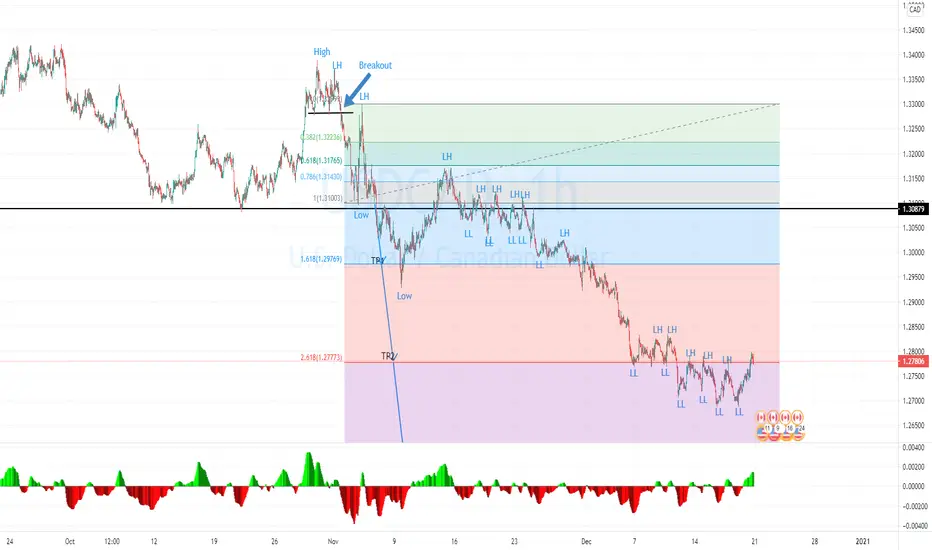
USDCAD on the 1H time-frame.
Steps:
1. The price still running downtrend by created the lower high and lower low.
2. The price already hit TP1: 1.29769 and TP2: 1.27773 at the Fibonacci level.
3. The next level is TP3: 1.25431 and 1.24546 at the support zone in Day time frame.
4. If the next MACD (-) create the higher low then there will be the 1st step of the reversal pattern.
Steps:
1. The price still running downtrend by created the lower high and lower low.
2. The price already hit TP1: 1.29769 and TP2: 1.27773 at the Fibonacci level.
3. The next level is TP3: 1.25431 and 1.24546 at the support zone in Day time frame.
4. If the next MACD (-) create the higher low then there will be the 1st step of the reversal pattern.

Declinazione di responsabilità
Le informazioni e le pubblicazioni non sono intese come, e non costituiscono, consulenza o raccomandazioni finanziarie, di investimento, di trading o di altro tipo fornite o approvate da TradingView. Per ulteriori informazioni, consultare i Termini di utilizzo.
Declinazione di responsabilità
Le informazioni e le pubblicazioni non sono intese come, e non costituiscono, consulenza o raccomandazioni finanziarie, di investimento, di trading o di altro tipo fornite o approvate da TradingView. Per ulteriori informazioni, consultare i Termini di utilizzo.