

USDCAD Weekly chart gives us an indication of overall price momentum to the downside as price has retested the weekly resistance zone of 1.35200.
Overall a break in upwards channel from
1.34150 has seen USDCAD sustain its shorts over the last 3weeks.
After a break - Price will usually form a pullback/consolidation zone. Perfect for re-entries.
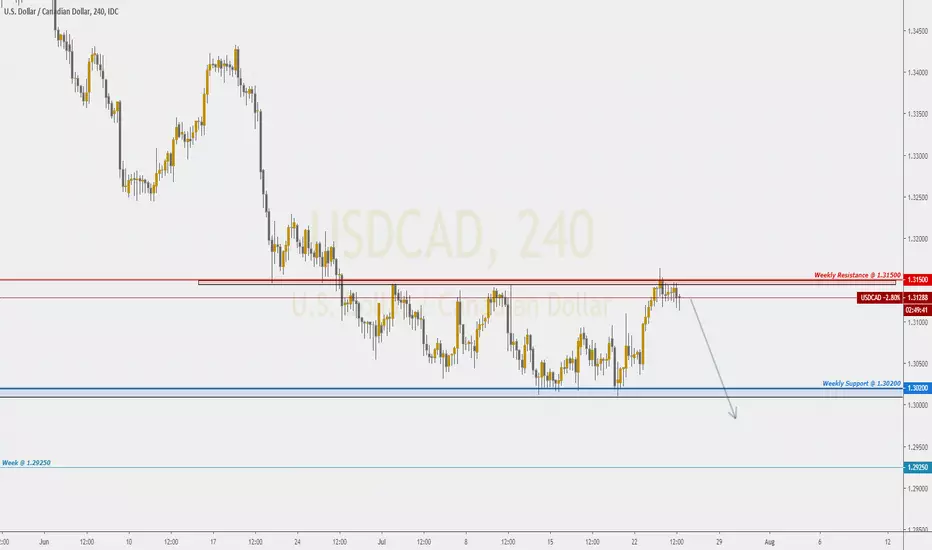
A Weekly Pullback from Support Zone of 1.30200 has encountered yet another wall of weekly resistance of 1.31500.
Weekly Depicted Below

Daily Chart gives us a bearish flag continuation pattern with ideal swing target set at 1.25000
See below D1

Down to the 4HR Chart, a huge range of consolidation confirms our higher time frame bias on going short on USDCAD Overall .

It is important to note that the only driver of higher CAD prices could indeed be fundamental news/ lower OIL prices.
Fundamentally CAD sees itself losing steam gained against the USD as FED may hold true of cutting rates.
Overall a break in upwards channel from
1.34150 has seen USDCAD sustain its shorts over the last 3weeks.
After a break - Price will usually form a pullback/consolidation zone. Perfect for re-entries.
A Weekly Pullback from Support Zone of 1.30200 has encountered yet another wall of weekly resistance of 1.31500.
Weekly Depicted Below
Daily Chart gives us a bearish flag continuation pattern with ideal swing target set at 1.25000
See below D1
Down to the 4HR Chart, a huge range of consolidation confirms our higher time frame bias on going short on USDCAD Overall .
It is important to note that the only driver of higher CAD prices could indeed be fundamental news/ lower OIL prices.
Fundamentally CAD sees itself losing steam gained against the USD as FED may hold true of cutting rates.

Declinazione di responsabilità
Le informazioni e le pubblicazioni non sono intese come, e non costituiscono, consulenza o raccomandazioni finanziarie, di investimento, di trading o di altro tipo fornite o approvate da TradingView. Per ulteriori informazioni, consultare i Termini di utilizzo.
Declinazione di responsabilità
Le informazioni e le pubblicazioni non sono intese come, e non costituiscono, consulenza o raccomandazioni finanziarie, di investimento, di trading o di altro tipo fornite o approvate da TradingView. Per ulteriori informazioni, consultare i Termini di utilizzo.