

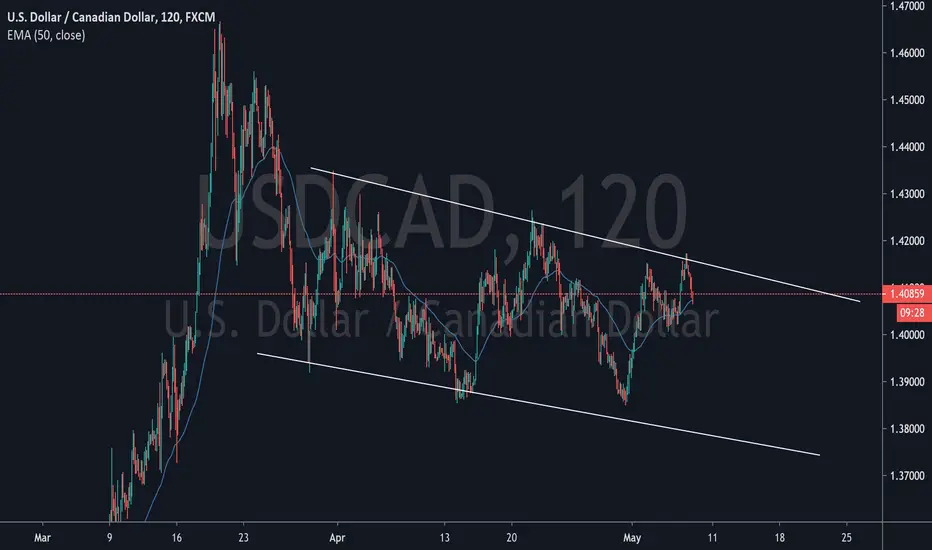
– Time = 2H
– Structure = Downtrend
– Pattern = Downtrend channel
– Tendency = Downtrend
– Monthly Candle retests Fibonacci resistance.
– 4hr Chart indicates an inverse hummer retested at the dynamic resistance level
– Price created a downtrend channel forming LH and LL.
– Hence the EMA 50 day is below the price, my analysis indicates a BEARISH MARKET
-----------------
Disclaimer: Forex trading and trading in other leveraged products involves a significant level of risk and is not suitable for all investors.
– Structure = Downtrend
– Pattern = Downtrend channel
– Tendency = Downtrend
– Monthly Candle retests Fibonacci resistance.
– 4hr Chart indicates an inverse hummer retested at the dynamic resistance level
– Price created a downtrend channel forming LH and LL.
– Hence the EMA 50 day is below the price, my analysis indicates a BEARISH MARKET
-----------------
Disclaimer: Forex trading and trading in other leveraged products involves a significant level of risk and is not suitable for all investors.
Trade chiuso: obiettivo raggiunto

Declinazione di responsabilità
Le informazioni e le pubblicazioni non sono intese come, e non costituiscono, consulenza o raccomandazioni finanziarie, di investimento, di trading o di altro tipo fornite o approvate da TradingView. Per ulteriori informazioni, consultare i Termini di utilizzo.
Declinazione di responsabilità
Le informazioni e le pubblicazioni non sono intese come, e non costituiscono, consulenza o raccomandazioni finanziarie, di investimento, di trading o di altro tipo fornite o approvate da TradingView. Per ulteriori informazioni, consultare i Termini di utilizzo.