

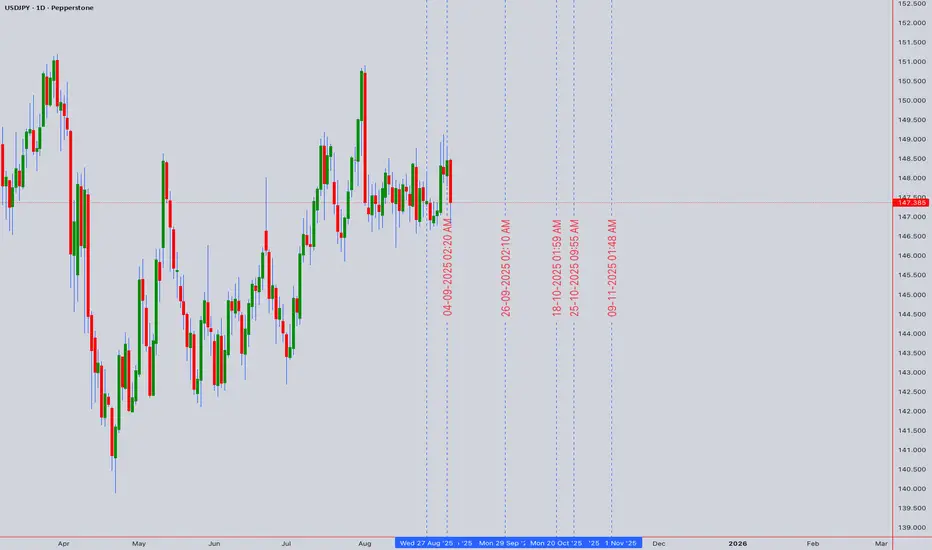
🔮 USDJPY Technical Forecast & Trading Strategy | Week of Sept 6th, 2025
Current Spot Price: 147.385 | CFD | Date: Sept 6, 2025
🟢 Overall Bias: BULLISH | The pair is trading within a clear bullish structure on higher timeframes. All pullbacks are currently being bought, indicating strong underlying demand.
📊 Multi-Timeframe Technical Breakdown
1. Chart Pattern & Theory Convergence:
🚩 Bullish Continuation Patterns: The price action from the August low exhibits characteristics of a Bull Flag or an Ascending Channel. A clean break above the 148.00 resistance would confirm this pattern and open a path significantly higher.
📐 Gann Theory & Square of 9: The current price is consolidating near a key Gann angle. A hold above 147.00 is crucial for the bulls to maintain control and propel price towards the next Gann objective near 148.80-149.20.
🌊 Elliott Wave Theory: The rally from the late August low is impulsive in nature, suggesting this is part of a larger Wave 3 or Wave C push higher. Any dip is likely a Wave 4 correction before a final Wave 5 thrust.
☁️ Ichimoku Kinko Hyo: A strongly bullish configuration. The price is well above the Kumo (Cloud), the Tenkan-sen (9) is above the Kijun-sen (26), and the Cloud itself is bullish. This is a classic trend-following signal.
2. Key Indicator Signals:
📶 RSI (14): On the 4H chart, the RSI is holding firmly in bullish territory (above 50) and has not reached overbought (>70) levels, suggesting there is more room for the trend to run. 🟢
📏 Bollinger Bands (20,2): Price is riding the upper band, a sign of strong momentum. Any pullback would likely find support at the middle band (20 SMA ~146.80), which is rising.
⚖️ VWAP & Anchored VWAP: The price is trading well above the daily and weekly VWAP, confirming that the trend is strong and the average participant is long and in profit.
📈 Moving Averages: The key EMA's (50, 100, 200) are all bullishly aligned and acting as dynamic support. The 50 EMA on the 4H chart (~146.90) is a key level for bulls to defend.
3. Critical Support & Resistance:
🎯 Immediate Resistance: 148.00 (Psychological, Recent High)
🎯 Key Resistance: 149.20 - 149.50 (Gann Target, Previous Swing High)
🛡️ Immediate Support: 147.00 - 146.90 (Previous Resistance, 50 EMA)
🛡️ Strong Support: 146.20 - 146.00 (Kijun-sen, Key Fibonacci Level)
🛡️ Major Support: 145.00 (Top of Ichimoku Cloud)
⚡ Trading Strategies & Setups
A. Intraday Trading (5M - 1H Charts):
Strategy: Look for long opportunities on dips towards support. Use bullish candlestick patterns (Hammer, Bullish Engulfing) near the 147.00 or 146.90 levels for high-probability entries.
Long Entry (Ideal): ~147.10 - 146.95 | Stop Loss: 146.60 | Take Profit 1: 147.80 | Take Profit 2: 148.50
Breakout Long: On a decisive break and hold above 148.10, with a target of 148.80.
B. Swing Trading (4H - D Charts):
Strategy: The bullish structure and Ichimoku alignment favor continued upside. Any dip into support is a potential buying opportunity for a larger move.
Swing Long Entry: On a pullback to 146.90-146.70 (Buy the Dip) OR a daily close above 148.20 (Breakout Buy).
Stop Loss: Below 146.20 | Target 1: 149.20 | Target 2: 150.00+
Bearish Invalidation: A decisive break and close below 145.80 (into the cloud) would invalidate the immediate bullish bias and signal a deeper correction.
🌍 Market Context & Risk Factors
Interest Rate Divergence: This is the core driver. The pair is highly sensitive to the US Dollar (USD) strength and Bank of Japan (BoJ) policy. Hawkish Fed rhetoric vs. dovish BoJ stance is profoundly bullish for USDJPY. 👁️ Watch for any unexpected BoJ intervention hints.
Risk Sentiment: Traditionally a "risk-off" proxy, but currently driven more by yield differentials. Monitor global equity markets and geopolitical events for sudden flight-to-safety flows into the JPY.
✅ Key Takeaways:
The Trend is Your Friend! 🐂 All higher-timeframe signals point to a robust bullish trend.
Ichimoku is Bullish. The price above a bullish cloud is a strong trend-confirmation signal.
Buy the Dips. The strategy favors entering on short-term weakness toward support rather than chasing the breakout.
Mind the BoJ. The largest risk is verbal or physical intervention from the Bank of Japan, which can cause violent, sharp reversals.
For individuals seeking to enhance their trading abilities based on the analyses provided, I recommend exploring the mentoring program offered by Shunya Trade. (Website: shunya dot trade)
I would appreciate your feedback on this analysis, as it will serve as a valuable resource for future endeavors.
Sincerely,
Shunya.Trade
Website: shunya dot trade
⚠️Disclaimer: This post is intended solely for educational purposes and does not constitute investment advice, financial advice, or trading recommendations. The views expressed herein are derived from technical analysis and are shared for informational purposes only. The stock market inherently carries risks, including the potential for capital loss. Therefore, readers are strongly advised to exercise prudent judgment before making any investment decisions. We assume no liability for any actions taken based on this content. For personalized guidance, it is recommended to consult a certified financial advisor.
Current Spot Price: 147.385 | CFD | Date: Sept 6, 2025
🟢 Overall Bias: BULLISH | The pair is trading within a clear bullish structure on higher timeframes. All pullbacks are currently being bought, indicating strong underlying demand.
📊 Multi-Timeframe Technical Breakdown
1. Chart Pattern & Theory Convergence:
🚩 Bullish Continuation Patterns: The price action from the August low exhibits characteristics of a Bull Flag or an Ascending Channel. A clean break above the 148.00 resistance would confirm this pattern and open a path significantly higher.
📐 Gann Theory & Square of 9: The current price is consolidating near a key Gann angle. A hold above 147.00 is crucial for the bulls to maintain control and propel price towards the next Gann objective near 148.80-149.20.
🌊 Elliott Wave Theory: The rally from the late August low is impulsive in nature, suggesting this is part of a larger Wave 3 or Wave C push higher. Any dip is likely a Wave 4 correction before a final Wave 5 thrust.
☁️ Ichimoku Kinko Hyo: A strongly bullish configuration. The price is well above the Kumo (Cloud), the Tenkan-sen (9) is above the Kijun-sen (26), and the Cloud itself is bullish. This is a classic trend-following signal.
2. Key Indicator Signals:
📶 RSI (14): On the 4H chart, the RSI is holding firmly in bullish territory (above 50) and has not reached overbought (>70) levels, suggesting there is more room for the trend to run. 🟢
📏 Bollinger Bands (20,2): Price is riding the upper band, a sign of strong momentum. Any pullback would likely find support at the middle band (20 SMA ~146.80), which is rising.
⚖️ VWAP & Anchored VWAP: The price is trading well above the daily and weekly VWAP, confirming that the trend is strong and the average participant is long and in profit.
📈 Moving Averages: The key EMA's (50, 100, 200) are all bullishly aligned and acting as dynamic support. The 50 EMA on the 4H chart (~146.90) is a key level for bulls to defend.
3. Critical Support & Resistance:
🎯 Immediate Resistance: 148.00 (Psychological, Recent High)
🎯 Key Resistance: 149.20 - 149.50 (Gann Target, Previous Swing High)
🛡️ Immediate Support: 147.00 - 146.90 (Previous Resistance, 50 EMA)
🛡️ Strong Support: 146.20 - 146.00 (Kijun-sen, Key Fibonacci Level)
🛡️ Major Support: 145.00 (Top of Ichimoku Cloud)
⚡ Trading Strategies & Setups
A. Intraday Trading (5M - 1H Charts):
Strategy: Look for long opportunities on dips towards support. Use bullish candlestick patterns (Hammer, Bullish Engulfing) near the 147.00 or 146.90 levels for high-probability entries.
Long Entry (Ideal): ~147.10 - 146.95 | Stop Loss: 146.60 | Take Profit 1: 147.80 | Take Profit 2: 148.50
Breakout Long: On a decisive break and hold above 148.10, with a target of 148.80.
B. Swing Trading (4H - D Charts):
Strategy: The bullish structure and Ichimoku alignment favor continued upside. Any dip into support is a potential buying opportunity for a larger move.
Swing Long Entry: On a pullback to 146.90-146.70 (Buy the Dip) OR a daily close above 148.20 (Breakout Buy).
Stop Loss: Below 146.20 | Target 1: 149.20 | Target 2: 150.00+
Bearish Invalidation: A decisive break and close below 145.80 (into the cloud) would invalidate the immediate bullish bias and signal a deeper correction.
🌍 Market Context & Risk Factors
Interest Rate Divergence: This is the core driver. The pair is highly sensitive to the US Dollar (USD) strength and Bank of Japan (BoJ) policy. Hawkish Fed rhetoric vs. dovish BoJ stance is profoundly bullish for USDJPY. 👁️ Watch for any unexpected BoJ intervention hints.
Risk Sentiment: Traditionally a "risk-off" proxy, but currently driven more by yield differentials. Monitor global equity markets and geopolitical events for sudden flight-to-safety flows into the JPY.
✅ Key Takeaways:
The Trend is Your Friend! 🐂 All higher-timeframe signals point to a robust bullish trend.
Ichimoku is Bullish. The price above a bullish cloud is a strong trend-confirmation signal.
Buy the Dips. The strategy favors entering on short-term weakness toward support rather than chasing the breakout.
Mind the BoJ. The largest risk is verbal or physical intervention from the Bank of Japan, which can cause violent, sharp reversals.
For individuals seeking to enhance their trading abilities based on the analyses provided, I recommend exploring the mentoring program offered by Shunya Trade. (Website: shunya dot trade)
I would appreciate your feedback on this analysis, as it will serve as a valuable resource for future endeavors.
Sincerely,
Shunya.Trade
Website: shunya dot trade
⚠️Disclaimer: This post is intended solely for educational purposes and does not constitute investment advice, financial advice, or trading recommendations. The views expressed herein are derived from technical analysis and are shared for informational purposes only. The stock market inherently carries risks, including the potential for capital loss. Therefore, readers are strongly advised to exercise prudent judgment before making any investment decisions. We assume no liability for any actions taken based on this content. For personalized guidance, it is recommended to consult a certified financial advisor.

I am nothing @shunya.trade
Declinazione di responsabilità
Le informazioni e le pubblicazioni non sono intese come, e non costituiscono, consulenza o raccomandazioni finanziarie, di investimento, di trading o di altro tipo fornite o approvate da TradingView. Per ulteriori informazioni, consultare i Termini di utilizzo.
I am nothing @shunya.trade
Declinazione di responsabilità
Le informazioni e le pubblicazioni non sono intese come, e non costituiscono, consulenza o raccomandazioni finanziarie, di investimento, di trading o di altro tipo fornite o approvate da TradingView. Per ulteriori informazioni, consultare i Termini di utilizzo.