

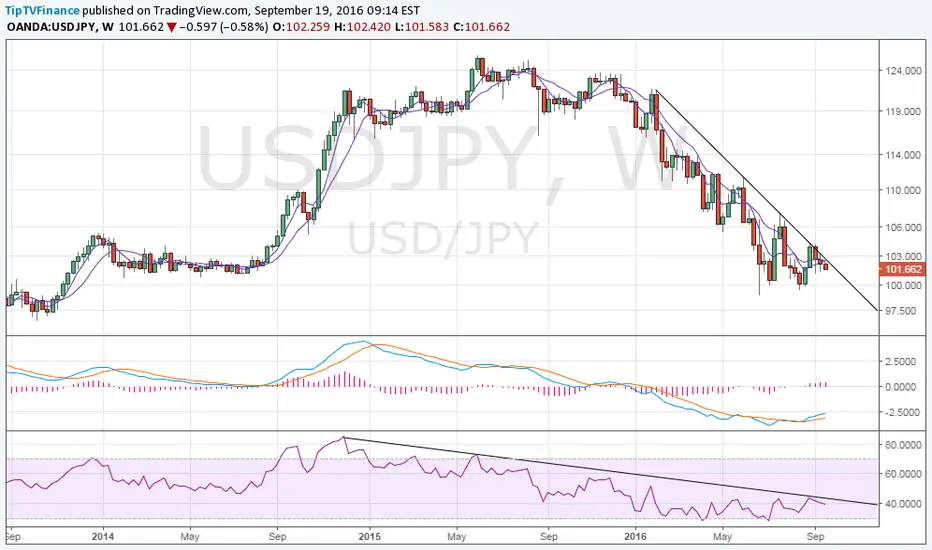
Weekly chart shows the descending trend line on the price chart and RSI is very much intact.
However, note the repeated rebound from near 99-100 levels and the bullish crossover between MACD lines.
Hence, the odds of the pair breaching the descending trendline are high and a much safer short trade would be below 100.00 levels.
However, note the repeated rebound from near 99-100 levels and the bullish crossover between MACD lines.
Hence, the odds of the pair breaching the descending trendline are high and a much safer short trade would be below 100.00 levels.

Pubblicazioni correlate
Declinazione di responsabilità
Le informazioni e le pubblicazioni non sono intese come, e non costituiscono, consulenza o raccomandazioni finanziarie, di investimento, di trading o di altro tipo fornite o approvate da TradingView. Per ulteriori informazioni, consultare i Termini di utilizzo.
Pubblicazioni correlate
Declinazione di responsabilità
Le informazioni e le pubblicazioni non sono intese come, e non costituiscono, consulenza o raccomandazioni finanziarie, di investimento, di trading o di altro tipo fornite o approvate da TradingView. Per ulteriori informazioni, consultare i Termini di utilizzo.