

🔍 Technical Analysis of USD/JPY
📌 Overall Trend:
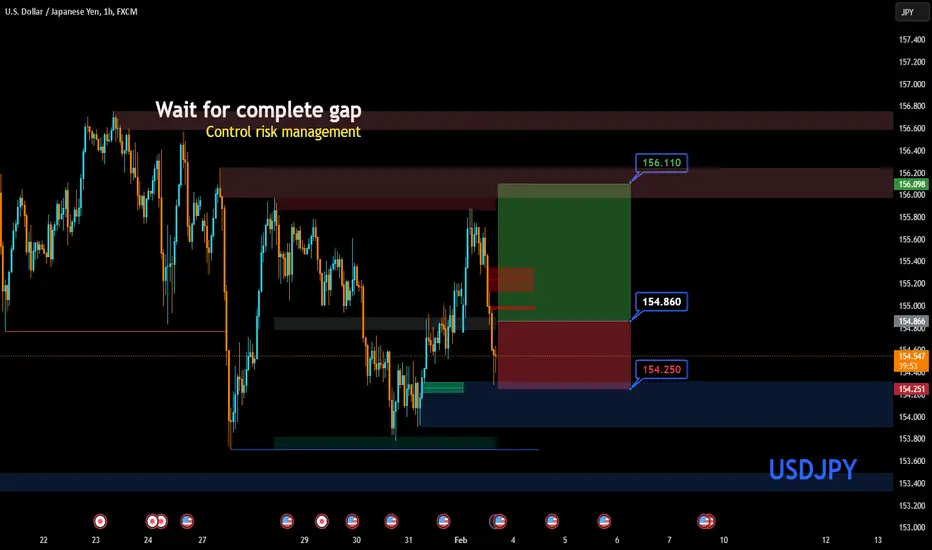
After a downward correction, the price has reached the 154.250 support zone.
A positive reaction at this level suggests a potential upward move.
A price gap is visible in the 156.000 - 156.400 range, which may lead to a price increase to fill the gap.
📈 Buy Trade Signal (Long Position)
🔹 Entry Conditions:
If the price holds the 154.250 - 154.400 support zone and bullish reversal candlesticks appear, a long trade is recommended.
The ideal entry range is 154.600 - 154.860.
🔹 Stop Loss (SL):
Below 154.250
🔹 Take Profit (TP):
First target: 155.860
Second target: 156.110
Third target: 156.400 (if the bullish momentum continues)
🔹 Risk Management:
If the price stabilizes below 154.250, reconsider the trade.
Breaking above 156.110 increases the likelihood of further bullish movement to fill the price gap.
✅ Final Conclusion:
If the price finds support at 154.250 - 154.400, a buy trade is favorable.
A breakout above 156.110 could lead to a further target of 156.400.
📌 Ensure confirmation through price action and candlestick patterns before entering the trade.
📌 Overall Trend:
After a downward correction, the price has reached the 154.250 support zone.
A positive reaction at this level suggests a potential upward move.
A price gap is visible in the 156.000 - 156.400 range, which may lead to a price increase to fill the gap.
📈 Buy Trade Signal (Long Position)
🔹 Entry Conditions:
If the price holds the 154.250 - 154.400 support zone and bullish reversal candlesticks appear, a long trade is recommended.
The ideal entry range is 154.600 - 154.860.
🔹 Stop Loss (SL):
Below 154.250
🔹 Take Profit (TP):
First target: 155.860
Second target: 156.110
Third target: 156.400 (if the bullish momentum continues)
🔹 Risk Management:
If the price stabilizes below 154.250, reconsider the trade.
Breaking above 156.110 increases the likelihood of further bullish movement to fill the price gap.
✅ Final Conclusion:
If the price finds support at 154.250 - 154.400, a buy trade is favorable.
A breakout above 156.110 could lead to a further target of 156.400.
📌 Ensure confirmation through price action and candlestick patterns before entering the trade.

Pubblicazioni correlate
Declinazione di responsabilità
Le informazioni e le pubblicazioni non sono intese come, e non costituiscono, consulenza o raccomandazioni finanziarie, di investimento, di trading o di altro tipo fornite o approvate da TradingView. Per ulteriori informazioni, consultare i Termini di utilizzo.
Pubblicazioni correlate
Declinazione di responsabilità
Le informazioni e le pubblicazioni non sono intese come, e non costituiscono, consulenza o raccomandazioni finanziarie, di investimento, di trading o di altro tipo fornite o approvate da TradingView. Per ulteriori informazioni, consultare i Termini di utilizzo.