
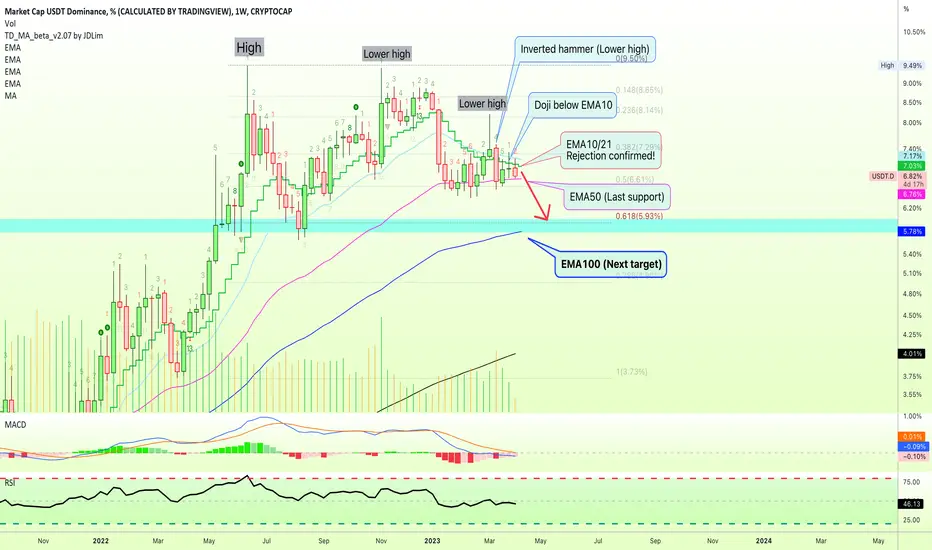
Since everything I share is bullish, it is good to read the Tether Dominance chart to look at some of the bearish signals, for learning and entertainment.
We have the lower highs mixed with candlestick reading.
1) The inverted hammer as a lower high (double strength).
2) Doji after lower high inverted hammer (triple strength bearish signal).
3) Rejection at EMA10 and EMA21 (additional confirmation more strength to previously noted bearish signals).
4) MACD moves below 0 trading below signal line.
5) RSI trending lower and downtrend since June 2022.
We want to see the action... Let it drop!
Let the entire Cryptocurrency (Bitcoin + Altcoins) market go up.
Namaste.
We have the lower highs mixed with candlestick reading.
1) The inverted hammer as a lower high (double strength).
2) Doji after lower high inverted hammer (triple strength bearish signal).
3) Rejection at EMA10 and EMA21 (additional confirmation more strength to previously noted bearish signals).
4) MACD moves below 0 trading below signal line.
5) RSI trending lower and downtrend since June 2022.
We want to see the action... Let it drop!
Let the entire Cryptocurrency (Bitcoin + Altcoins) market go up.
Namaste.
Nota
USDT.D Daily timeframe has gone full bearish: The daily session is about to close and we have a full rejection at EMA50, EMA21 and EMA10.
The MACD is curving down below zero.
Bitcoin is still sideways so this means that USDT is being used to buy Altcoins...
That's for sure, the Altcoins vs Bitcoin pairs are really taking off.

Trading Cryptocurrencies can be the hardest undertaking ever without the right trade-numbers, without accurate private-access information. Free is free, but the best always requires sweat, an investment. Since 2017 👇
t.me/masteranandatrades/8778
t.me/masteranandatrades/8778
Pubblicazioni correlate
Declinazione di responsabilità
Le informazioni e le pubblicazioni non sono intese come, e non costituiscono, consulenza o raccomandazioni finanziarie, di investimento, di trading o di altro tipo fornite o approvate da TradingView. Per ulteriori informazioni, consultare i Termini di utilizzo.
Trading Cryptocurrencies can be the hardest undertaking ever without the right trade-numbers, without accurate private-access information. Free is free, but the best always requires sweat, an investment. Since 2017 👇
t.me/masteranandatrades/8778
t.me/masteranandatrades/8778
Pubblicazioni correlate
Declinazione di responsabilità
Le informazioni e le pubblicazioni non sono intese come, e non costituiscono, consulenza o raccomandazioni finanziarie, di investimento, di trading o di altro tipo fornite o approvate da TradingView. Per ulteriori informazioni, consultare i Termini di utilizzo.