
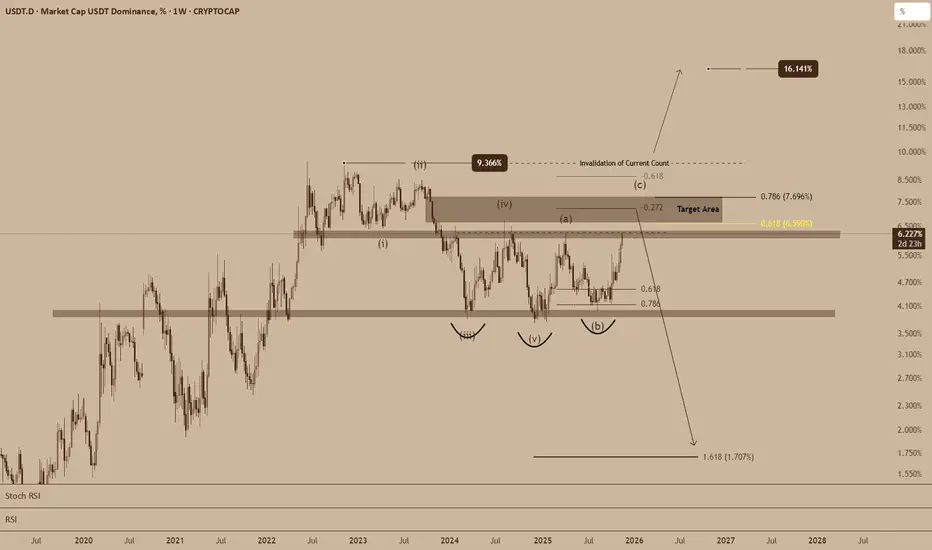
USDT.D – Reaching a Critical Inflection Zone (Elliott Wave + Fibs + S/R)
USDT Dominance is approaching a major decision point that has repeatedly acted as a structural pivot for crypto cycle rotations. With price pressing into a heavy multi-year supply zone around 6.3–7.0%, the current rise appears to be completing one of two higher-degree structures:
A corrective ABC where the market is finishing wave (c) of B,
Or a deeper Elliott Wave correction completing wave (c) of 2 before a larger risk-on impulse begins.
Both interpretations converge toward the same conclusion: USDT.D is nearing exhaustion, and the reaction here will likely set the tone for broader crypto trends heading into 2025–2026.
Elliott Wave Structure
The current advance fits cleanly within a corrective pattern. After the large impulsive decline, price carved out the classic five-wave drop into the 2024–2025 bottom. The rebound has since unfolded in a clear counter-trend form, with wave (a) and (b) already established and wave (c) extending into the upper resistance band.
The 6.5–7.0% zone is particularly important because it sits just beneath the invalidation level of the current wave count and marks the upper boundary of the corrective channel. Any strong rejection here would confirm the completion of wave (c) under both scenarios.
Fibonacci Confluence (Why This Area Matters)
The region USDT.D is testing is reinforced by multiple Fibonacci signals:
0.618 retracement of the previous decline
0.272 extension aligning with (c) projections
0.786 retracement as an upper limit on aggressive B-wave/extensions
Confluence between the fibs and long-term horizontal resistance
This creates a powerful “cluster zone” suggesting diminishing upside potential.
Major Support & Resistance Structure
The chart shows clear historical behavior around these key areas:
6.3–7.0% → Multi-year supply zone
This zone rejected price in past cycles and corresponds with corrective wave tops.
3.8–4.2% → Primary demand zone
This level aligns with previous accumulation, neckline structures, and fib retracements.
If USDT.D reverses, this zone becomes the first key target.
1.7% (1.618 extension)
The macro downside projection, which historically aligns with strong altseason periods.
Inverted Head & Shoulders Within Elliott Wave Context
A unique feature of this structure is the inverted head and shoulders that formed during the bottoming phase:
Left shoulder → wave (iii)
Head → wave (v)
Right shoulder → wave (b)
This is a classic Elliott Wave phenomenon. H&S (and inverted H&S) patterns often appear during transitional phases between impulsive and corrective structures, especially near the end of wave 1 or wave 2.
In this case, the iH&S acted as the springboard for the current rise — but it also signals that the corrective upside may be near completion.
Macro Projection: What Happens If We Reject?
A clean rejection from the 6.3–7.0% resistance would imply:
Completion of wave (c) of B or wave (c) of 2
Start of a major downside leg toward the 4% zone
Potential continuation into the 1.618 extension near 1.7%
Historically, such declines in USDT.D correlate with broad crypto strength, BTC rallies, and altcoin expansions.
Conclusion:
USDT Dominance is sitting at a highly compressed, multi-confluence resistance zone that aligns perfectly with both Elliott Wave and Fibonacci symmetry. Whether this structure resolves as completion of B or wave 2, the message is the same:
This is a high-risk area for dominance upside and a high-potential area for crypto risk-on rotation.
A decisive reaction in the coming weeks will likely define the next major phase of the crypto market
USDT Dominance is approaching a major decision point that has repeatedly acted as a structural pivot for crypto cycle rotations. With price pressing into a heavy multi-year supply zone around 6.3–7.0%, the current rise appears to be completing one of two higher-degree structures:
A corrective ABC where the market is finishing wave (c) of B,
Or a deeper Elliott Wave correction completing wave (c) of 2 before a larger risk-on impulse begins.
Both interpretations converge toward the same conclusion: USDT.D is nearing exhaustion, and the reaction here will likely set the tone for broader crypto trends heading into 2025–2026.
Elliott Wave Structure
The current advance fits cleanly within a corrective pattern. After the large impulsive decline, price carved out the classic five-wave drop into the 2024–2025 bottom. The rebound has since unfolded in a clear counter-trend form, with wave (a) and (b) already established and wave (c) extending into the upper resistance band.
The 6.5–7.0% zone is particularly important because it sits just beneath the invalidation level of the current wave count and marks the upper boundary of the corrective channel. Any strong rejection here would confirm the completion of wave (c) under both scenarios.
Fibonacci Confluence (Why This Area Matters)
The region USDT.D is testing is reinforced by multiple Fibonacci signals:
0.618 retracement of the previous decline
0.272 extension aligning with (c) projections
0.786 retracement as an upper limit on aggressive B-wave/extensions
Confluence between the fibs and long-term horizontal resistance
This creates a powerful “cluster zone” suggesting diminishing upside potential.
Major Support & Resistance Structure
The chart shows clear historical behavior around these key areas:
6.3–7.0% → Multi-year supply zone
This zone rejected price in past cycles and corresponds with corrective wave tops.
3.8–4.2% → Primary demand zone
This level aligns with previous accumulation, neckline structures, and fib retracements.
If USDT.D reverses, this zone becomes the first key target.
1.7% (1.618 extension)
The macro downside projection, which historically aligns with strong altseason periods.
Inverted Head & Shoulders Within Elliott Wave Context
A unique feature of this structure is the inverted head and shoulders that formed during the bottoming phase:
Left shoulder → wave (iii)
Head → wave (v)
Right shoulder → wave (b)
This is a classic Elliott Wave phenomenon. H&S (and inverted H&S) patterns often appear during transitional phases between impulsive and corrective structures, especially near the end of wave 1 or wave 2.
In this case, the iH&S acted as the springboard for the current rise — but it also signals that the corrective upside may be near completion.
Macro Projection: What Happens If We Reject?
A clean rejection from the 6.3–7.0% resistance would imply:
Completion of wave (c) of B or wave (c) of 2
Start of a major downside leg toward the 4% zone
Potential continuation into the 1.618 extension near 1.7%
Historically, such declines in USDT.D correlate with broad crypto strength, BTC rallies, and altcoin expansions.
Conclusion:
USDT Dominance is sitting at a highly compressed, multi-confluence resistance zone that aligns perfectly with both Elliott Wave and Fibonacci symmetry. Whether this structure resolves as completion of B or wave 2, the message is the same:
This is a high-risk area for dominance upside and a high-potential area for crypto risk-on rotation.
A decisive reaction in the coming weeks will likely define the next major phase of the crypto market

Declinazione di responsabilità
Le informazioni e le pubblicazioni non sono intese come, e non costituiscono, consulenza o raccomandazioni finanziarie, di investimento, di trading o di altro tipo fornite o approvate da TradingView. Per ulteriori informazioni, consultare i Termini di utilizzo.
Declinazione di responsabilità
Le informazioni e le pubblicazioni non sono intese come, e non costituiscono, consulenza o raccomandazioni finanziarie, di investimento, di trading o di altro tipo fornite o approvate da TradingView. Per ulteriori informazioni, consultare i Termini di utilizzo.