
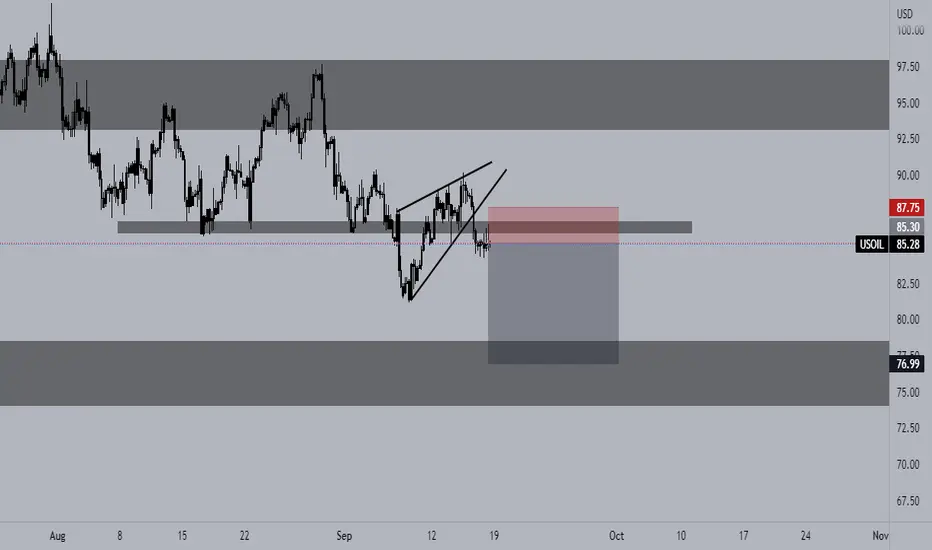
From the W1 timeframe, we can see a double top pattern that successfully broken the neckline confirming bearish pressure. Also, last weeks WI candle closed bearish confirming sell momentum.
On the D1, we can clearly see that price pulled back after what looked like a head and shoulders pattern and after failing to break the neckline slumped back below support. This also indicates strong bearish momentum.
Finally on my entry timeframe the H4, we see the ascending wedge which broke and came back to support to resistance before heading lower.

Declinazione di responsabilità
Le informazioni e le pubblicazioni non sono intese come, e non costituiscono, consulenza o raccomandazioni finanziarie, di investimento, di trading o di altro tipo fornite o approvate da TradingView. Per ulteriori informazioni, consultare i Termini di utilizzo.
Declinazione di responsabilità
Le informazioni e le pubblicazioni non sono intese come, e non costituiscono, consulenza o raccomandazioni finanziarie, di investimento, di trading o di altro tipo fornite o approvate da TradingView. Per ulteriori informazioni, consultare i Termini di utilizzo.