📊 Technical Structure
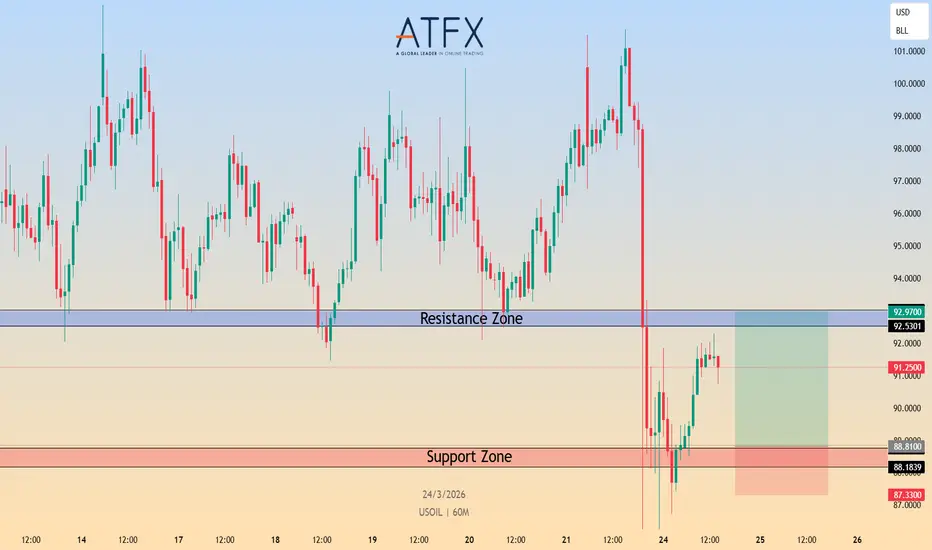
 USOIL On the 60-minute (60M) chart dated March 24, 2026, USOIL (WTI) has staged a rebound to approximately $91.00 after suffering a sharp 9% decline in the previous session. The price is currently recovering from a deep sell-off, moving away from the newly established Support Zone between $88.18 – $88.81.
On the upside, the primary Resistance Zone is situated between $92.53 – $92.97. This area previously acted as a significant floor and is now expected to offer stiff resistance on any recovery attempts. The current price action indicates a technical bounce as the market weighs supply-side shocks against the recent temporary delay in strikes.
Short-term bias: Neutral/Bullish while holding above $88.18.
Key Resistance: $92.53 – $92.97.
Key Support: $88.18 – $88.81.
🎯 Trade Setup (Buy-on-Support Scenario)
Entry Zone: $88.18 – $88.81 (Accumulating long positions within the primary horizontal support floor).
Stop Loss: $87.33 (Placed strictly below the structural support floor to manage risk).
Take Profit 1: $91.00.
Take Profit 2: $92.53.
Risk–Reward Ratio: Approx. 1.2.81.
📌 Invalidation: A decisive hourly candle close below $87.33 would invalidate the bullish support thesis, suggesting a reduction in the immediate geopolitical risk premium.
🌐 Macro Background
The fundamental landscape for Crude Oil is driven by extreme geopolitical volatility and supply-chain uncertainty:
Regional Escalation: Saudi Arabia has signalled a potential shift toward direct military involvement in the Iran conflict. This comes as Israel confirms a second wave of strikes on Tehran’s infrastructure.
Strait of Hormuz Status: While some LPG vessels have crossed under strict Iranian control, the passage remains highly restricted. The disruption of this chokepoint (20% of global supply) remains a primary risk driver.
Conflicting Narratives: Oil prices fell previously on President Trump’s 5-day delay of strikes. However, Iranian officials have denied any negotiations, vowing to continue the conflict.
🔑 Key Technical Levels
Resistance Zone: $92.53 – $92.97.
Support Zone: $88.18 – $88.81.
📌 Trade Summary
WTI is currently benefiting from a "buy-the-dip" mentality as the market prices in the risk of direct Gulf state involvement. The technical floor at $88.18 remains the critical area for bulls to defend to maintain recovery momentum.
Preferred strategy: Seek long opportunities on minor intraday pullbacks toward the $88.81 area, targeting the $92.53 resistance zone.
⚠️ Disclaimer
This analysis is for reference only and does not constitute trading advice. Financial markets involve significant risk; proper risk and position management are essential.
USOIL On the 60-minute (60M) chart dated March 24, 2026, USOIL (WTI) has staged a rebound to approximately $91.00 after suffering a sharp 9% decline in the previous session. The price is currently recovering from a deep sell-off, moving away from the newly established Support Zone between $88.18 – $88.81.On the upside, the primary Resistance Zone is situated between $92.53 – $92.97. This area previously acted as a significant floor and is now expected to offer stiff resistance on any recovery attempts. The current price action indicates a technical bounce as the market weighs supply-side shocks against the recent temporary delay in strikes.
Short-term bias: Neutral/Bullish while holding above $88.18.
Key Resistance: $92.53 – $92.97.
Key Support: $88.18 – $88.81.
🎯 Trade Setup (Buy-on-Support Scenario)
Entry Zone: $88.18 – $88.81 (Accumulating long positions within the primary horizontal support floor).
Stop Loss: $87.33 (Placed strictly below the structural support floor to manage risk).
Take Profit 1: $91.00.
Take Profit 2: $92.53.
Risk–Reward Ratio: Approx. 1.2.81.
📌 Invalidation: A decisive hourly candle close below $87.33 would invalidate the bullish support thesis, suggesting a reduction in the immediate geopolitical risk premium.
🌐 Macro Background
The fundamental landscape for Crude Oil is driven by extreme geopolitical volatility and supply-chain uncertainty:
Regional Escalation: Saudi Arabia has signalled a potential shift toward direct military involvement in the Iran conflict. This comes as Israel confirms a second wave of strikes on Tehran’s infrastructure.
Strait of Hormuz Status: While some LPG vessels have crossed under strict Iranian control, the passage remains highly restricted. The disruption of this chokepoint (20% of global supply) remains a primary risk driver.
Conflicting Narratives: Oil prices fell previously on President Trump’s 5-day delay of strikes. However, Iranian officials have denied any negotiations, vowing to continue the conflict.
🔑 Key Technical Levels
Resistance Zone: $92.53 – $92.97.
Support Zone: $88.18 – $88.81.
📌 Trade Summary
WTI is currently benefiting from a "buy-the-dip" mentality as the market prices in the risk of direct Gulf state involvement. The technical floor at $88.18 remains the critical area for bulls to defend to maintain recovery momentum.
Preferred strategy: Seek long opportunities on minor intraday pullbacks toward the $88.81 area, targeting the $92.53 resistance zone.
⚠️ Disclaimer
This analysis is for reference only and does not constitute trading advice. Financial markets involve significant risk; proper risk and position management are essential.

ATFX is a globally regulated, award-winning fintech broker offering customer support in 20 languages.
👉🏼Start your trading journey with ATFX: bit.ly/3mLMPHz
👉🏼Start your trading journey with ATFX: bit.ly/3mLMPHz
Declinazione di responsabilità
Le informazioni e le pubblicazioni non sono intese come, e non costituiscono, consulenza o raccomandazioni finanziarie, di investimento, di trading o di altro tipo fornite o approvate da TradingView. Per ulteriori informazioni, consultare i Termini di utilizzo.
ATFX is a globally regulated, award-winning fintech broker offering customer support in 20 languages.
👉🏼Start your trading journey with ATFX: bit.ly/3mLMPHz
👉🏼Start your trading journey with ATFX: bit.ly/3mLMPHz
Declinazione di responsabilità
Le informazioni e le pubblicazioni non sono intese come, e non costituiscono, consulenza o raccomandazioni finanziarie, di investimento, di trading o di altro tipo fornite o approvate da TradingView. Per ulteriori informazioni, consultare i Termini di utilizzo.