
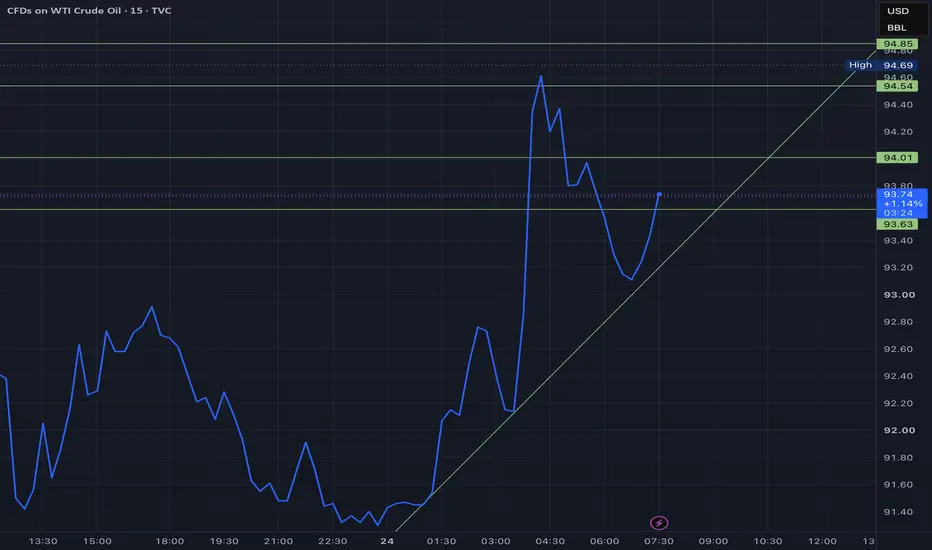
This is what the mornings radar for USOIL looks like. $93.63 is a crucial monthly support level for this Fibonacci Volatility Cipher. Bouncing above the line. Looks very bullish. These price levels are long-term, and this chart is long-term. $200 is completely reasonable under this financial model. If you zoom out and look upwards on the chart, you will cleanly notice monthly steps upwards that are expected to gain logarithmically for the next cycle.
Nota
Bullseye!Nota
Two bulls to one bear ratio atm. Internal votes say the price continues to move up.
Declinazione di responsabilità
Le informazioni e le pubblicazioni non sono intese come, e non costituiscono, consulenza o raccomandazioni finanziarie, di investimento, di trading o di altro tipo fornite o approvate da TradingView. Per ulteriori informazioni, consultare i Termini di utilizzo.
Declinazione di responsabilità
Le informazioni e le pubblicazioni non sono intese come, e non costituiscono, consulenza o raccomandazioni finanziarie, di investimento, di trading o di altro tipo fornite o approvate da TradingView. Per ulteriori informazioni, consultare i Termini di utilizzo.