
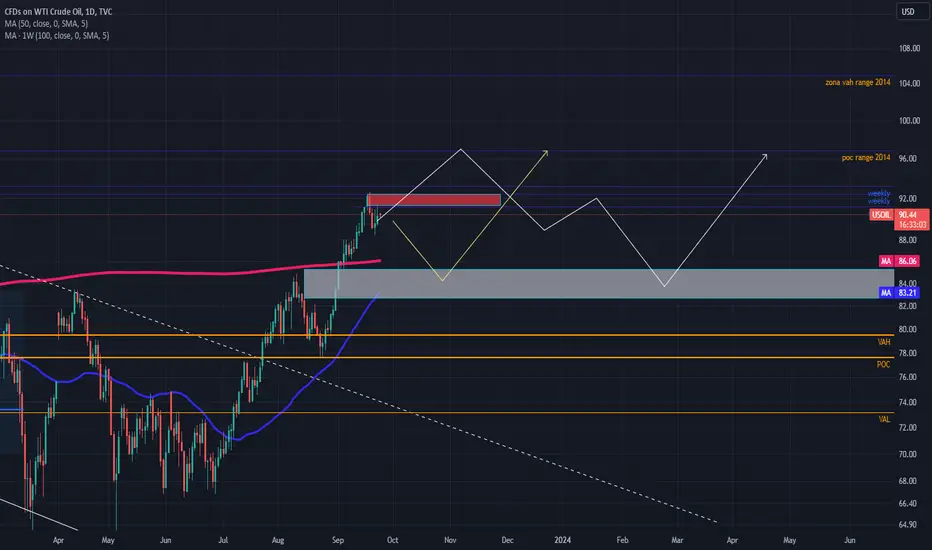
After showing a weakening, profit was taken at $92 and I'm ready to jump in if the setup shows something bullish.
The red rectangle shows where the orders are and that the price failed to close above and therefore we got a new weekly level.
These are the two probabilities I'm looking at, which give the same result for LONG.
The Techniques
Below I am looking at 0.3 Fibonacci, the wave of the last range (05.Oct-5.Nov.), the last Higher High, 100 Weekly MA and 50 Daily MA.
My final target is still $104-$106, but if the setup is shown, of course I will enter again.
The red rectangle shows where the orders are and that the price failed to close above and therefore we got a new weekly level.
These are the two probabilities I'm looking at, which give the same result for LONG.
The Techniques
Below I am looking at 0.3 Fibonacci, the wave of the last range (05.Oct-5.Nov.), the last Higher High, 100 Weekly MA and 50 Daily MA.
My final target is still $104-$106, but if the setup is shown, of course I will enter again.
Nota
84.93 50dma and VAL of previous range, good zone for buy if trend do not changeNota
Nota
After that two level we will get 84.66
Nota
Nota
Nota
below this, 80$ another try

Pubblicazioni correlate
Declinazione di responsabilità
Le informazioni e le pubblicazioni non sono intese come, e non costituiscono, consulenza o raccomandazioni finanziarie, di investimento, di trading o di altro tipo fornite o approvate da TradingView. Per ulteriori informazioni, consultare i Termini di utilizzo.
Pubblicazioni correlate
Declinazione di responsabilità
Le informazioni e le pubblicazioni non sono intese come, e non costituiscono, consulenza o raccomandazioni finanziarie, di investimento, di trading o di altro tipo fornite o approvate da TradingView. Per ulteriori informazioni, consultare i Termini di utilizzo.