
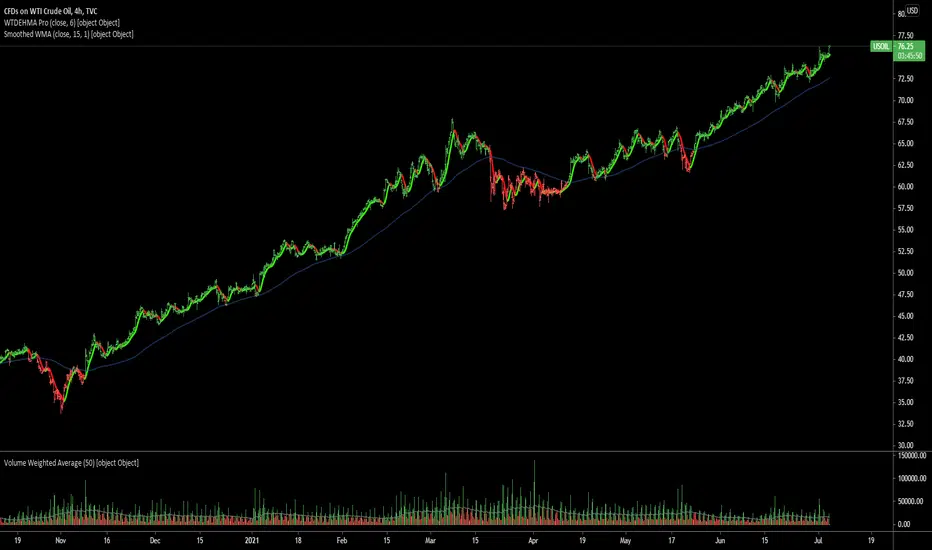
For more than a year, we can see where Crude Oil has been moving and it latest price. Our 160 WMA and smoothed technical indicators can show a beautiful trace over the chart. A nice daily chart can also be plotted to see its great trend. While no statement of continuation or a change in trend, just illustrating the general view of some recent history.

Declinazione di responsabilità
Le informazioni e le pubblicazioni non sono intese come, e non costituiscono, consulenza o raccomandazioni finanziarie, di investimento, di trading o di altro tipo fornite o approvate da TradingView. Per ulteriori informazioni, consultare i Termini di utilizzo.
Declinazione di responsabilità
Le informazioni e le pubblicazioni non sono intese come, e non costituiscono, consulenza o raccomandazioni finanziarie, di investimento, di trading o di altro tipo fornite o approvate da TradingView. Per ulteriori informazioni, consultare i Termini di utilizzo.