
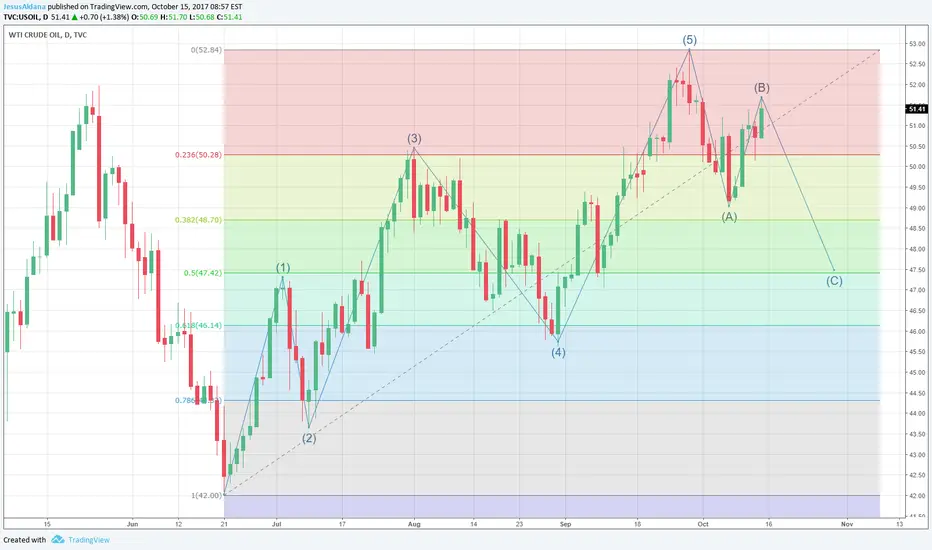
On a daily chart WTI has performed under an Elliot Wave Pattern since July. It's final trend wave ended on late September with help of OPEP statment of commitment to current output and Turkey's threat to cut oil production.
Since then bears have taken control in Oil industry. Wave A managed to touch Fibbonaci 38% level before entering wave B. Although we can't confirm at this stage final price of Wave B since it needs to show some red candles. As for now prices can still go further up and break $53 level.
However if this doesn't occure this week. Prices are projected in a downtrend forming Wave C. Most optimistic scenario would be Fibonacci 50% at $47.50.
For more analysis visit investing.com/members/200755314
Trade attivo
Red candles starting to bundle
Declinazione di responsabilità
Le informazioni e le pubblicazioni non sono intese come, e non costituiscono, consulenza o raccomandazioni finanziarie, di investimento, di trading o di altro tipo fornite o approvate da TradingView. Per ulteriori informazioni, consultare i Termini di utilizzo.
Declinazione di responsabilità
Le informazioni e le pubblicazioni non sono intese come, e non costituiscono, consulenza o raccomandazioni finanziarie, di investimento, di trading o di altro tipo fornite o approvate da TradingView. Per ulteriori informazioni, consultare i Termini di utilizzo.