
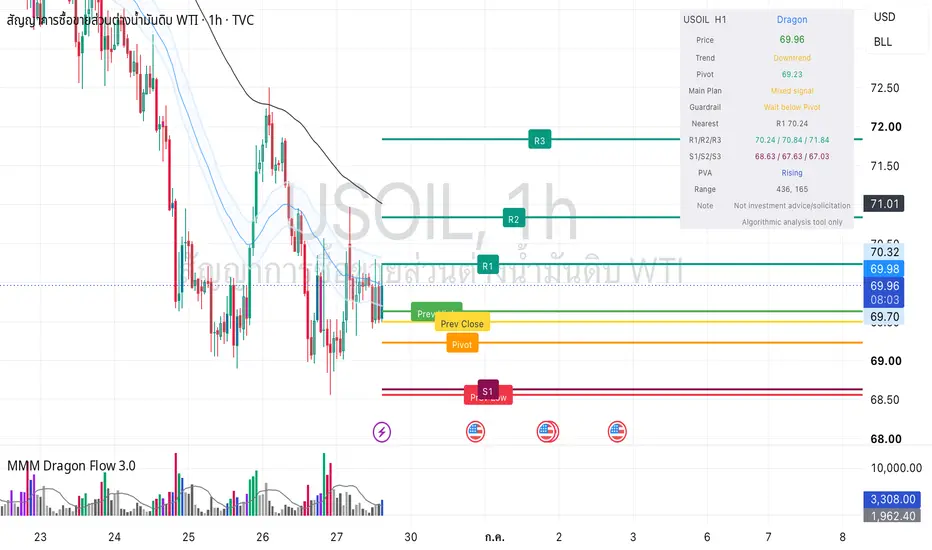
USOIL / WTI Crude Oil CFD 1H Technical Outlook
Date: Monday, June 29, 2026
Instrument: USOIL / WTI Crude Oil CFD
Timeframe: 1H
Current Price Area: 69.99
Market Condition: Sideways / Recovery Attempt
WTI Crude Oil is currently trading around the 69.99 area on the 1H timeframe. Price is holding above the Pivot Point at 69.23 and is attempting to build a short-term recovery after the previous downside leg.
The broader structure is still not a clean bullish trend. Price has bounced from the lower range, but it is now approaching the first resistance zone at R1: 70.24. This is a tactical decision area. From a CFD trader’s perspective, chasing into resistance is not ideal unless price can break and hold above R1 with clear momentum confirmation.
The current structure suggests that buyers are trying to stabilize the market above the pivot, but the next directional move depends on whether price can clear resistance or reject and rotate lower.
⸻
Key Levels
Resistance Levels:
* R1: 70.24
* R2: 70.84
* R3: 71.84
Pivot Point:
* Pivot: 69.23
Support Levels:
* S1: 68.63
* S2: 67.63
* S3: 67.03
⸻
Trading Tool Perspective
The trading assistant tool currently shows:
* Trend: Sideways
* Main Plan: Sideways
* Guardrail: Wait for breakout or pullback
* Nearest Key Level: R1 at 70.24
* PVA Status: Rising
The tool is reading the market as sideways, but the PVA condition is now rising, which means participation is increasing compared with the previous normal-volume phase. This does not automatically confirm a breakout, but it does tell us that the current area deserves attention.
A sustained break above 70.24 could strengthen the bullish recovery case and open the path toward 70.84, with 71.84 as the next upside reference. However, if price rejects from R1 and fails to hold above the pivot, sellers may attempt to push the market back toward 68.63.
The cleaner tactical scenarios are:
1. Bullish breakout scenario:
Price breaks and holds above R1 at 70.24 with stronger momentum and rising volume confirmation.
2. Pullback-buy scenario:
Price pulls back toward the pivot at 69.23, holds above it, and forms a bullish rejection structure.
3. Bearish rejection scenario:
Price fails at R1, loses short-term structure, and rotates back toward the pivot and S1.
For now, USOIL remains in a sideways recovery attempt. The market is above the pivot, but R1 is the immediate barrier. Confirmation above 70.24 is needed before treating this as a stronger bullish continuation setup.
⸻
Risk Warning
This analysis is for educational purposes only and does not constitute financial advice, investment advice, or a trading signal. Trading crude oil CFDs, futures, commodities, forex, and leveraged products involves significant risk and may not be suitable for all traders. Leverage can amplify both profits and losses. Always define your risk before entering a position, use proper position sizing, and trade only according to your own strategy, capital size, and risk tolerance.
Date: Monday, June 29, 2026
Instrument: USOIL / WTI Crude Oil CFD
Timeframe: 1H
Current Price Area: 69.99
Market Condition: Sideways / Recovery Attempt
WTI Crude Oil is currently trading around the 69.99 area on the 1H timeframe. Price is holding above the Pivot Point at 69.23 and is attempting to build a short-term recovery after the previous downside leg.
The broader structure is still not a clean bullish trend. Price has bounced from the lower range, but it is now approaching the first resistance zone at R1: 70.24. This is a tactical decision area. From a CFD trader’s perspective, chasing into resistance is not ideal unless price can break and hold above R1 with clear momentum confirmation.
The current structure suggests that buyers are trying to stabilize the market above the pivot, but the next directional move depends on whether price can clear resistance or reject and rotate lower.
⸻
Key Levels
Resistance Levels:
* R1: 70.24
* R2: 70.84
* R3: 71.84
Pivot Point:
* Pivot: 69.23
Support Levels:
* S1: 68.63
* S2: 67.63
* S3: 67.03
⸻
Trading Tool Perspective
The trading assistant tool currently shows:
* Trend: Sideways
* Main Plan: Sideways
* Guardrail: Wait for breakout or pullback
* Nearest Key Level: R1 at 70.24
* PVA Status: Rising
The tool is reading the market as sideways, but the PVA condition is now rising, which means participation is increasing compared with the previous normal-volume phase. This does not automatically confirm a breakout, but it does tell us that the current area deserves attention.
A sustained break above 70.24 could strengthen the bullish recovery case and open the path toward 70.84, with 71.84 as the next upside reference. However, if price rejects from R1 and fails to hold above the pivot, sellers may attempt to push the market back toward 68.63.
The cleaner tactical scenarios are:
1. Bullish breakout scenario:
Price breaks and holds above R1 at 70.24 with stronger momentum and rising volume confirmation.
2. Pullback-buy scenario:
Price pulls back toward the pivot at 69.23, holds above it, and forms a bullish rejection structure.
3. Bearish rejection scenario:
Price fails at R1, loses short-term structure, and rotates back toward the pivot and S1.
For now, USOIL remains in a sideways recovery attempt. The market is above the pivot, but R1 is the immediate barrier. Confirmation above 70.24 is needed before treating this as a stronger bullish continuation setup.
⸻
Risk Warning
This analysis is for educational purposes only and does not constitute financial advice, investment advice, or a trading signal. Trading crude oil CFDs, futures, commodities, forex, and leveraged products involves significant risk and may not be suitable for all traders. Leverage can amplify both profits and losses. Always define your risk before entering a position, use proper position sizing, and trade only according to your own strategy, capital size, and risk tolerance.

Declinazione di responsabilità
Le informazioni e le pubblicazioni non sono intese come, e non costituiscono, consulenza o raccomandazioni finanziarie, di investimento, di trading o di altro tipo fornite o approvate da TradingView. Per ulteriori informazioni, consultare i Termini di utilizzo.
Declinazione di responsabilità
Le informazioni e le pubblicazioni non sono intese come, e non costituiscono, consulenza o raccomandazioni finanziarie, di investimento, di trading o di altro tipo fornite o approvate da TradingView. Per ulteriori informazioni, consultare i Termini di utilizzo.