
Hello traders,
Core Logic: Technical Breakdown + U.S. Firms’ Invasion of Venezuelan Oil Resources → Supply Surge Pressures Prices
1. Core Trading Logic
1. Technical Side: Support Break Unlocks Downside Room
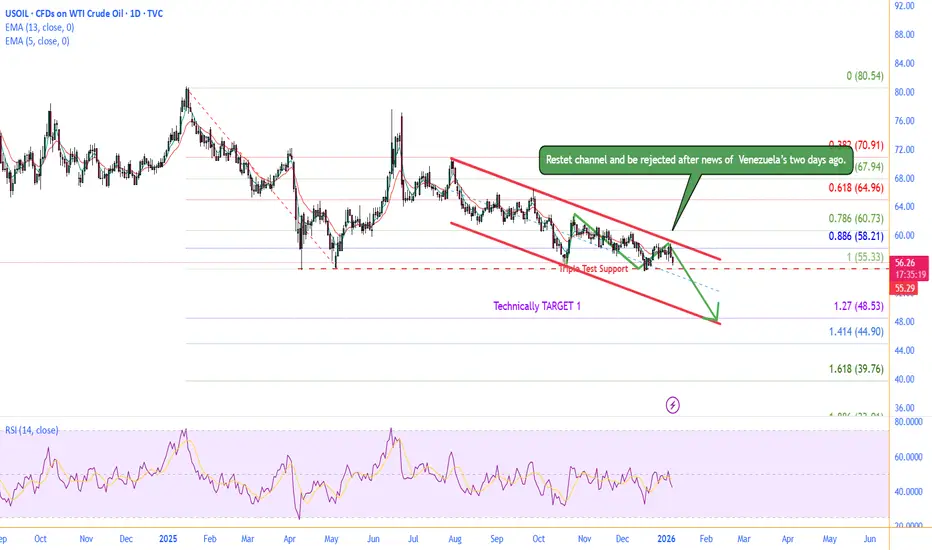
The "Triple Test Support (55.33, marked as '1' on the chart)" is the key current support level. Once it’s effectively broken, the downside channel of the Fibonacci extension levels on the chart will be triggered;
2. Fundamental Side: Bearish Catalyst from U.S. Firms’ Invasion of Venezuelan Oil
If U.S. enterprises gain substantial access to Venezuela’s oil resources, it will directly boost global crude supply expectations — increased supply will fundamentally pressure oil prices, aligning with the U.S. need to lower domestic inflation via lower oil prices.
2. Trading Instrument & Timeframe
- Instrument: USOIL (WTI Crude Oil CFD)
- Timeframe: Daily chart
- Direction: Short (trend-following short position)
3. Entry Conditions (Technical + Fundamental Resonance)
1. Technical Break Confirmation: The daily closing price effectively breaks below 55.33 (the triple support level), accompanied by a large-bodied bearish candlestick or a breakaway engulfing pattern;
2. Indicator Alignment: RSI (14) breaks below 40 concurrently, confirming the continuation of weakness;
3. Event Catalyst: Enter the position on the back of substantive news (e.g., U.S. firms securing Venezuelan oil drilling/export rights).
4. Stop-Loss Strategy
Place the stop-loss above 57.0 (the recent daily rebound high + EMA5 resistance), keeping the single-trade stop-loss range around 1.7 points to avoid short-term rebound risks.
5. Take-Profit Targets (Aligned with Chart Markers)
1. 1st Target: The momentum-driven downside acceleration phase after the support break (the short-term swing following the invalidation of 55.33);
2. 2nd Target: 48.53 (the 1.27 Fibonacci extension level on the chart), close out positions gradually upon reaching this level.
6. Position Sizing & Risk Notes
- Position Sizing: Limit single-trade risk to ≤1.5% of account equity (e.g., ~0.3 standard lots for a $10,000 account);
- Note: If oil prices rebound and reclaim the 57.0 stop-loss level, close the position immediately — be wary of fundamental reversals (e.g., Venezuelan oil supply falling short of expectations).
GOOD LUCK!
LESS IS MORE!
Core Logic: Technical Breakdown + U.S. Firms’ Invasion of Venezuelan Oil Resources → Supply Surge Pressures Prices
1. Core Trading Logic
1. Technical Side: Support Break Unlocks Downside Room
The "Triple Test Support (55.33, marked as '1' on the chart)" is the key current support level. Once it’s effectively broken, the downside channel of the Fibonacci extension levels on the chart will be triggered;
2. Fundamental Side: Bearish Catalyst from U.S. Firms’ Invasion of Venezuelan Oil
If U.S. enterprises gain substantial access to Venezuela’s oil resources, it will directly boost global crude supply expectations — increased supply will fundamentally pressure oil prices, aligning with the U.S. need to lower domestic inflation via lower oil prices.
2. Trading Instrument & Timeframe
- Instrument: USOIL (WTI Crude Oil CFD)
- Timeframe: Daily chart
- Direction: Short (trend-following short position)
3. Entry Conditions (Technical + Fundamental Resonance)
1. Technical Break Confirmation: The daily closing price effectively breaks below 55.33 (the triple support level), accompanied by a large-bodied bearish candlestick or a breakaway engulfing pattern;
2. Indicator Alignment: RSI (14) breaks below 40 concurrently, confirming the continuation of weakness;
3. Event Catalyst: Enter the position on the back of substantive news (e.g., U.S. firms securing Venezuelan oil drilling/export rights).
4. Stop-Loss Strategy
Place the stop-loss above 57.0 (the recent daily rebound high + EMA5 resistance), keeping the single-trade stop-loss range around 1.7 points to avoid short-term rebound risks.
5. Take-Profit Targets (Aligned with Chart Markers)
1. 1st Target: The momentum-driven downside acceleration phase after the support break (the short-term swing following the invalidation of 55.33);
2. 2nd Target: 48.53 (the 1.27 Fibonacci extension level on the chart), close out positions gradually upon reaching this level.
6. Position Sizing & Risk Notes
- Position Sizing: Limit single-trade risk to ≤1.5% of account equity (e.g., ~0.3 standard lots for a $10,000 account);
- Note: If oil prices rebound and reclaim the 57.0 stop-loss level, close the position immediately — be wary of fundamental reversals (e.g., Venezuelan oil supply falling short of expectations).
GOOD LUCK!
LESS IS MORE!

Join Free Telegram Group to get MORE trading skills: t.me/FuntraderVera
Contact:
Tele: @VeraFuntrader
Wechat: ZIYUVERA
Contact:
Tele: @VeraFuntrader
Wechat: ZIYUVERA
Pubblicazioni correlate
Declinazione di responsabilità
Le informazioni e le pubblicazioni non sono intese come, e non costituiscono, consulenza o raccomandazioni finanziarie, di investimento, di trading o di altro tipo fornite o approvate da TradingView. Per ulteriori informazioni, consultare i Termini di utilizzo.
Join Free Telegram Group to get MORE trading skills: t.me/FuntraderVera
Contact:
Tele: @VeraFuntrader
Wechat: ZIYUVERA
Contact:
Tele: @VeraFuntrader
Wechat: ZIYUVERA
Pubblicazioni correlate
Declinazione di responsabilità
Le informazioni e le pubblicazioni non sono intese come, e non costituiscono, consulenza o raccomandazioni finanziarie, di investimento, di trading o di altro tipo fornite o approvate da TradingView. Per ulteriori informazioni, consultare i Termini di utilizzo.