
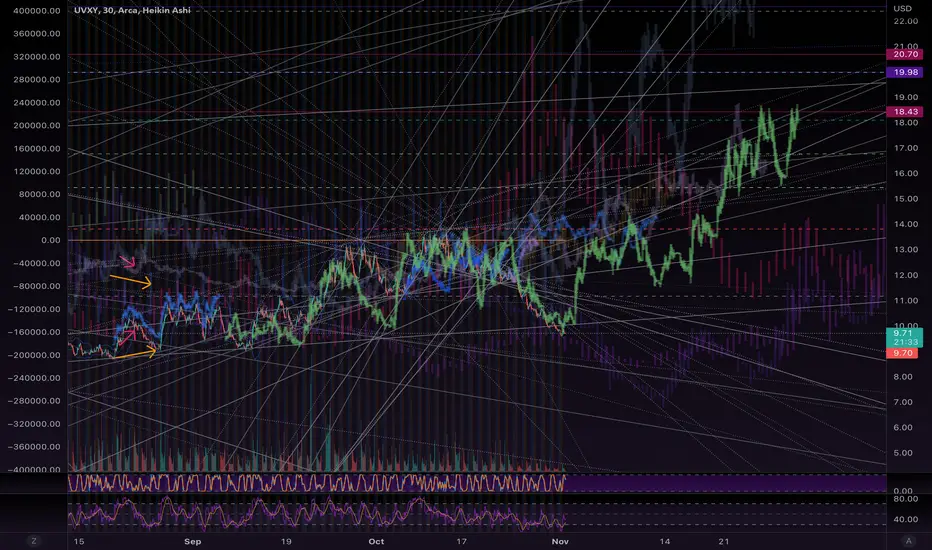
This is how the next level collapse would look in the UVXY Volatilty derivative. The SP500 is pretty much inverse of this.
Each movement propagates and grows as the crashes become increasingly volatile, as the historic inflationary levels of the entire market begin to collapse.
Good Luck, God Speed, Love & Light to all!
Each movement propagates and grows as the crashes become increasingly volatile, as the historic inflationary levels of the entire market begin to collapse.
Good Luck, God Speed, Love & Light to all!
Nota
Here is a long range view of the ES1 futures version of the SP500. It includes the overnight trading sessions in Europe and Asia, making for much more complete analysis data. We are in the beginning of the bright white trace… You should be able to cycle the (hide drawings) while viewing ideas, like this one.Follow along if you want to know when we add to these ideas :)

Declinazione di responsabilità
Le informazioni e le pubblicazioni non sono intese come, e non costituiscono, consulenza o raccomandazioni finanziarie, di investimento, di trading o di altro tipo fornite o approvate da TradingView. Per ulteriori informazioni, consultare i Termini di utilizzo.
Declinazione di responsabilità
Le informazioni e le pubblicazioni non sono intese come, e non costituiscono, consulenza o raccomandazioni finanziarie, di investimento, di trading o di altro tipo fornite o approvate da TradingView. Per ulteriori informazioni, consultare i Termini di utilizzo.