
Today, we will take a look at Visa.
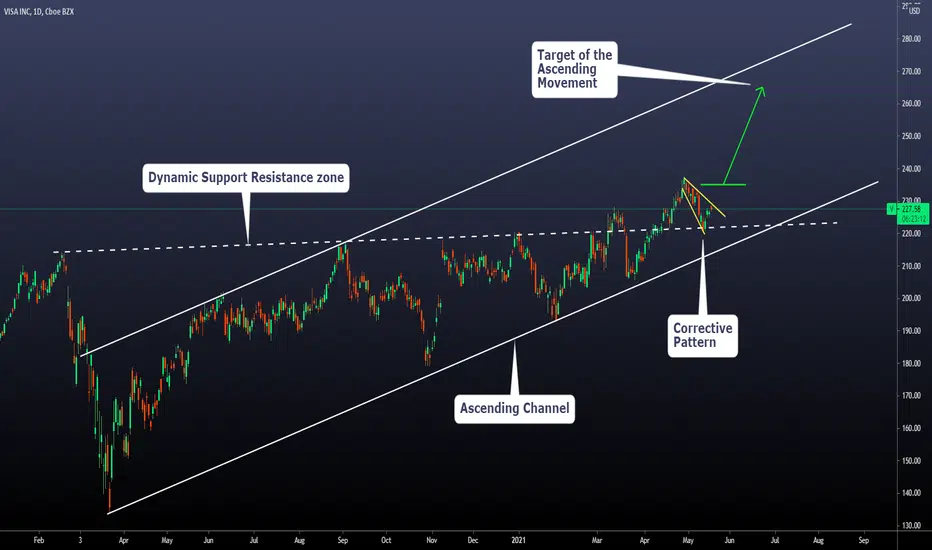
-The main aspect we can see is the ascending channel as the main bullish structure
-The second item we see on the chart is the dynamic support resistance zone that has been tested several times from above and below
-Currently, we observe a corrective structure that tends to behave as a continuation pattern after the breakout.
-Based on all the previous items. If the price reaches the green line, we will consider it an activation level for this view. Final Target the higher trendline of the ascending channel
-The expected duration for this movement if the price reaches the green line is between 30 and 50 days.
-The main aspect we can see is the ascending channel as the main bullish structure
-The second item we see on the chart is the dynamic support resistance zone that has been tested several times from above and below
-Currently, we observe a corrective structure that tends to behave as a continuation pattern after the breakout.
-Based on all the previous items. If the price reaches the green line, we will consider it an activation level for this view. Final Target the higher trendline of the ascending channel
-The expected duration for this movement if the price reaches the green line is between 30 and 50 days.

Declinazione di responsabilità
Le informazioni e le pubblicazioni non sono intese come, e non costituiscono, consulenza o raccomandazioni finanziarie, di investimento, di trading o di altro tipo fornite o approvate da TradingView. Per ulteriori informazioni, consultare i Termini di utilizzo.
Declinazione di responsabilità
Le informazioni e le pubblicazioni non sono intese come, e non costituiscono, consulenza o raccomandazioni finanziarie, di investimento, di trading o di altro tipo fornite o approvate da TradingView. Per ulteriori informazioni, consultare i Termini di utilizzo.