
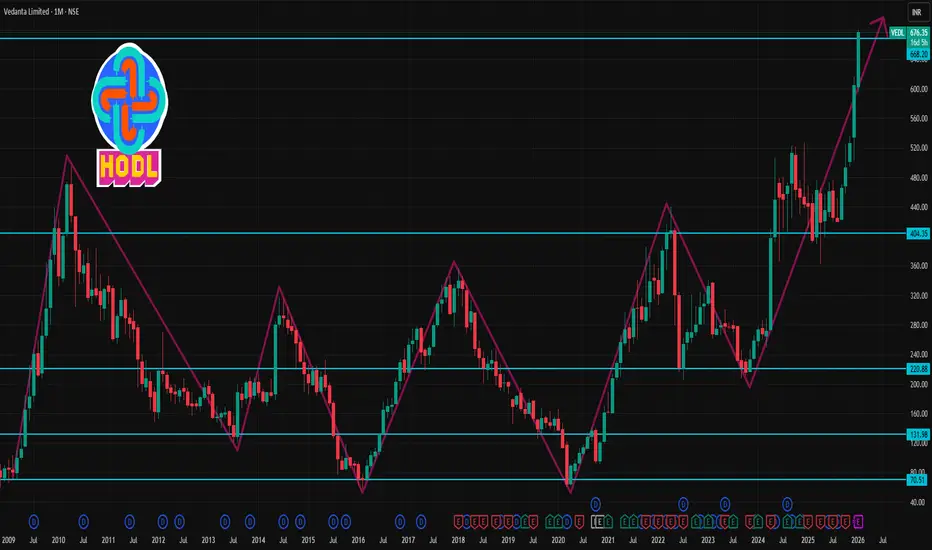
📌 Latest Market Context
• The stock is trading near multi‑month and all‑time highs (around ₹670+ on NSE) on strong momentum and positive sentiment after broker upgrades and structural catalysts.
• RSI readings suggest strong upside momentum but near overbought in some sources.
📈 1‑Month Timeframe Key Levels
(These combine pivot, swing support/resistance & recent price action ranges)
Resistance (Upside Targets)
₹656–₹660 — Upper daily pivot resistance zone.
₹650–₹656 — R2–R3 levels from technical pivot indicators.
Above ₹670–₹680 — Near current multi‑week highs / psychological zone (strong breakout if sustained).
Support (Downside Floors)
₹630–₹635 — Immediate pivot support (~S1) & short‑term cushion.
₹622–₹625 — Secondary demand zone near moving average clusters.
₹616–₹620 — Deeper swing support if short correction unfolds.
📊 What These Levels Mean
✅ Holding Above ₹630–₹635
Maintains bullish momentum in the 1‑month view.
Prospects for retesting ₹650+ and potentially ₹670–₹680 if buying continues.
⚠️ Break Below ₹620
Could open a pullback toward ₹616 and lower pivot zones before buyers re‑emerge.
A close below ~₹616 on monthly/daily charts may signal short‑term loss of structure.
📍 How to Use These Levels
Bullish Trade Setup (1M swing)
Buy or add near support ₹630–₹620 with stops slightly below ₹616
Targets: ₹650 → ₹670+
Neutral/Profit‑Taking Zone
₹650–₹670+ is the next potential resistance breakeven/exit zone
Bearish/Defensive
If price decisively closes below ₹620–₹616, reduce risk exposure and watch for support at lower levels.

Contact Knowledgehub for a detailed consultation: Dm on WhatsApp: [wa.link/a2o0kz]-
Phone No: [+91 93102 26243]-
Email: [tradingviewknowledgehub@gmail.com]---
-- Let’s achieve success together!
Phone No: [+91 93102 26243]-
Email: [tradingviewknowledgehub@gmail.com]---
-- Let’s achieve success together!
Pubblicazioni correlate
Declinazione di responsabilità
Le informazioni e le pubblicazioni non sono intese come, e non costituiscono, consulenza o raccomandazioni finanziarie, di investimento, di trading o di altro tipo fornite o approvate da TradingView. Per ulteriori informazioni, consultare i Termini di utilizzo.