
The  VET weekly chart is looking bullish AF.
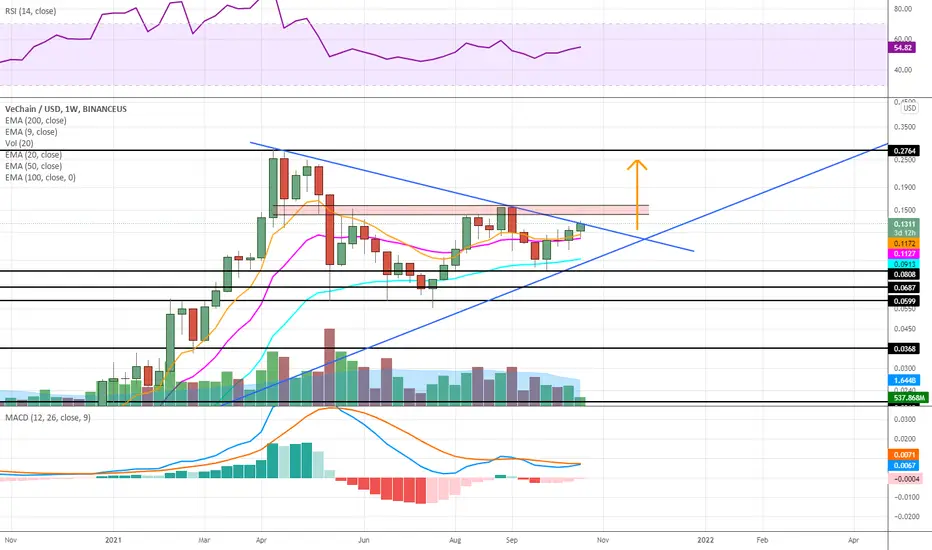
Held the 9EMA and 20EMA on the weekly timeframe and is pushing up again the blue downtrend line. Still see some resistance in the 0.15-0.16 area but if it can break it then we should see previous highs around 0.25-0.28.
VET weekly chart is looking bullish AF.Held the 9EMA and 20EMA on the weekly timeframe and is pushing up again the blue downtrend line. Still see some resistance in the 0.15-0.16 area but if it can break it then we should see previous highs around 0.25-0.28.

Declinazione di responsabilità
Le informazioni e le pubblicazioni non sono intese come, e non costituiscono, consulenza o raccomandazioni finanziarie, di investimento, di trading o di altro tipo fornite o approvate da TradingView. Per ulteriori informazioni, consultare i Termini di utilizzo.
Declinazione di responsabilità
Le informazioni e le pubblicazioni non sono intese come, e non costituiscono, consulenza o raccomandazioni finanziarie, di investimento, di trading o di altro tipo fornite o approvate da TradingView. Per ulteriori informazioni, consultare i Termini di utilizzo.