
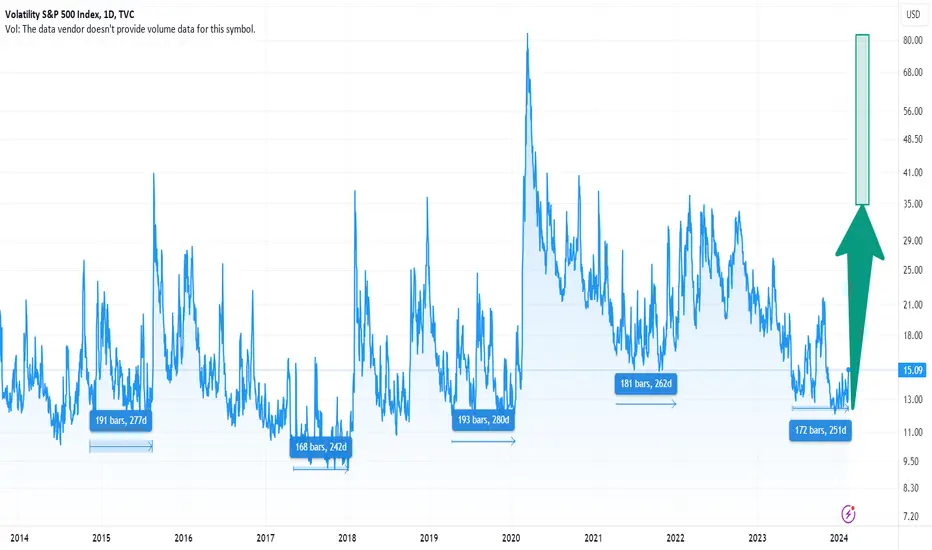
Historical data over the past 10 years shows that VIX bottoming phase usually lasts no more than 168-193 trading days. After that, a significant spike occurs, which sends the VIX to the 35-80+ zone. Even if today was not the starting point of this upside move, there is not much time left. We have already passed 172 trading days. Take this into account before establishing new positions. The date range where the VIX peak should occur is mid-March to mid-May.

Nota
Target reached. Current high value is 41.80. Let's see will it spike to 50-80 range.
Nota
Peaked at 65.73 within expected range.
Pubblicazioni correlate
Declinazione di responsabilità
Le informazioni e le pubblicazioni non sono intese come, e non costituiscono, consulenza o raccomandazioni finanziarie, di investimento, di trading o di altro tipo fornite o approvate da TradingView. Per ulteriori informazioni, consultare i Termini di utilizzo.