
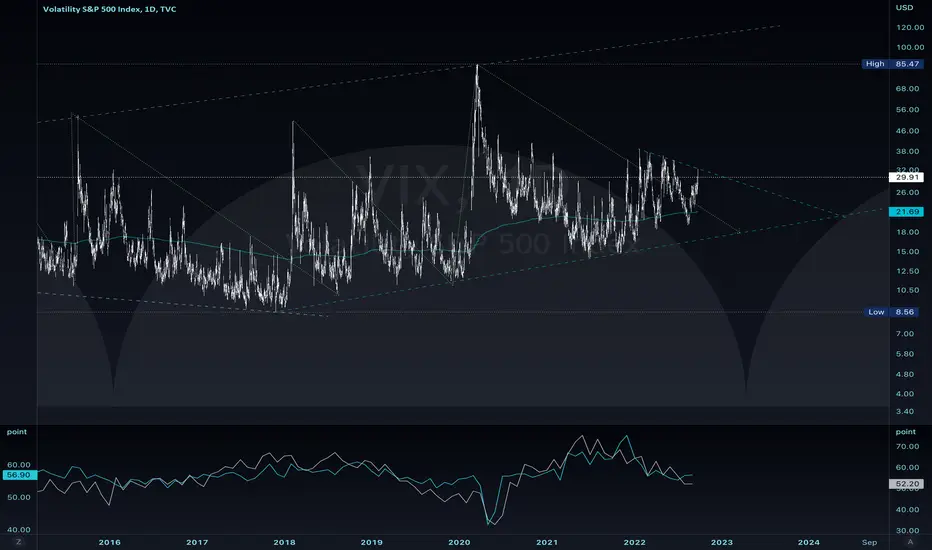
A macro view of VIX versus US Manufacturing and Non-Manufacturing PMI's with a visual aid for base time cycles.
Taking note without special emphasis of the 200 Week EMA of the VIX, which may be utilized as a confirming indicator a period of continued elevated volatility.
Chart is intended as a simple visual aid for contraction and expansion periods in the US economy.
Taking note without special emphasis of the 200 Week EMA of the VIX, which may be utilized as a confirming indicator a period of continued elevated volatility.
Chart is intended as a simple visual aid for contraction and expansion periods in the US economy.

Declinazione di responsabilità
Le informazioni e le pubblicazioni non sono intese come, e non costituiscono, consulenza o raccomandazioni finanziarie, di investimento, di trading o di altro tipo fornite o approvate da TradingView. Per ulteriori informazioni, consultare i Termini di utilizzo.
Declinazione di responsabilità
Le informazioni e le pubblicazioni non sono intese come, e non costituiscono, consulenza o raccomandazioni finanziarie, di investimento, di trading o di altro tipo fornite o approvate da TradingView. Per ulteriori informazioni, consultare i Termini di utilizzo.